











UK House Price Growth Slows Sharply
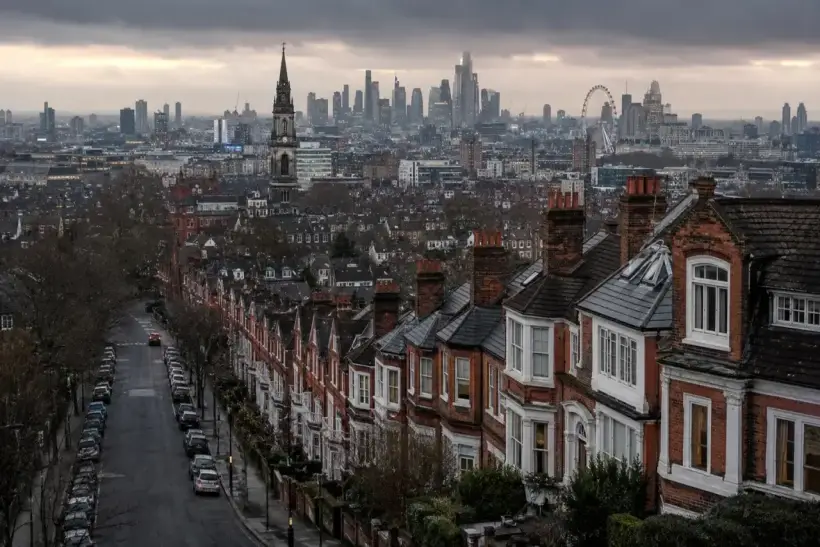
The latest official figures highlighted by Bloomberg on Aug. 19 point primarily to a sharp loss of momentum rather than a nationwide decline in property values. According to the August release from the Office for National Statistics, the average UK home was worth £272,000 in June, up 2.0% from a year earlier. The annual rate had been a revised 3.0% in May. On an unadjusted basis, prices rose just 0.1% between May and June, compared with a 1.0% increase in the same month of 2025.
After seasonal adjustment, however, the June index fell 0.2% from May. Negative monthly movement had also occurred earlier in 2026: the current March series shows a 0.4% unadjusted fall from February and a 0.2% seasonally adjusted decline. The more important signal is therefore the broader loss of annual momentum and widening divergence between regions and property types.
The June estimate remains provisional. The first release incorporates transaction records equivalent to roughly 47% of expected final Great Britain sales, meaning recent observations can be revised as further completed transactions are registered. Unless otherwise stated, the official housing figures are published on a non-seasonally adjusted basis.
London Falls While Northern England Keeps Growing
The average property in England was worth £293,000 in June, 1.8% more than a year earlier. Wales averaged £213,000, also up 1.8%, while Scotland reached £195,000 after a 2.3% increase. Northern Ireland continued to stand apart from the rest of the country: the second-quarter average reached £202,000, up 9.2% year on year, the strongest rate there since the fourth quarter of 2022.
The divide within England was equally pronounced. The North West recorded the strongest annual gain at 4.7%, taking the average price to about £220,000. The North East rose 4.3% to £166,000 and Yorkshire and the Humber gained 3.6% to £208,000. In the South East, by contrast, annual growth was only 0.3%, with the average property worth around £380,000.
London remained the weakest English region. The average capital property was worth approximately £554,000 in June, 2.5% less than a year earlier. It was the tenth consecutive month of annual declines, driven mainly by weakness in Inner London. On an unadjusted monthly basis, however, London prices rose 1.0% in June, underscoring the difference between short-term and annual measures.
Flats Lose Value While Houses Retain Gains
The national split by property type is increasingly clear. The average flat or maisonette was worth £193,711 in June, 1.6% less than a year earlier. Detached homes rose 2.3% to £444,652, semi-detached properties gained 3.4% to £277,332 and terraced homes increased 3.0% to £230,994.
The pattern was even weaker for flats in England, where the average dropped 2.3% to £219,000. Semi-detached homes gained 3.2%, terraced properties rose 2.8% and detached homes increased about 2.0%. This matters particularly in London and other large cities where flats make up a larger share of stock and first-time buyers are more exposed to mortgage costs and deposit requirements.
The national 2.0% annual gain therefore conceals several housing markets moving in opposite directions: flats are already cheaper than a year ago, London remains in decline, northern England is still rising and Northern Ireland continues to post unusually strong growth.
The 2025 Tax Change Still Distorts Comparisons
The slowdown is partly a consequence of changes to Stamp Duty Land Tax in England and Northern Ireland. Until March 31, 2025, the standard zero-rate threshold stood at £250,000, while first-time buyers paid no tax on the first £425,000 of a qualifying purchase costing no more than £625,000. Historical tax rates confirm those thresholds.
From April 1, 2025, the standard zero-rate threshold reverted to £125,000. The portion between £125,001 and £250,000 is taxed at 2%, the portion between £250,001 and £925,000 at 5%, between £925,001 and £1.5 million at 10%, and anything above £1.5 million at 12%. First-time buyer relief now provides a £300,000 zero-rate threshold but is unavailable where the purchase price exceeds £500,000. The current residential rates are set out in official guidance.
Buyers brought transactions forward into March 2025 before the thresholds changed, producing an abrupt drop in April followed by a rebound in May and June. Current annual comparisons are now being made against that rebound, mechanically reducing 2026 growth rates. Official housing statistics identify this base effect as a major reason for the sharp slowdown.
Non-resident buyers face additional costs. A purchaser who is not UK resident for the relevant tax test usually pays a two-percentage-point surcharge on residential property in England or Northern Ireland. Buying an additional residential property normally adds another five percentage points to the applicable rates, and the two surcharges can apply together.
Transactions Recover but Remain a Lagging Indicator
The latest HM Revenue & Customs transaction data put seasonally adjusted UK residential completions at about 98,700 in June. That was roughly 2% higher than a year earlier and less than 1% above May. On an unadjusted basis, 103,050 transactions were recorded, 6% more than in June 2025 and 11% above May.
Completed sales are not a real-time measure of current demand. The tax authority notes that a transaction typically completes two to four months after an initial offer is made, meaning much of June’s activity reflects decisions taken in the spring.
The 2025 tax deadline also generated unusually large swings in transaction volumes, with a March surge followed by an April collapse. Month-to-month comparisons around that period can therefore exaggerate the underlying movement unless the tax effect is taken into account.
Higher Mortgage Costs Continue to Restrict Buyers
The Bank of England kept its policy rate at 3.75% at the meeting ending July 29. The decision was taken by a 6–3 majority, with three members preferring an increase to 4.0%. Policymakers noted that financial conditions had tightened materially, raising financing costs for households and companies.
Mortgage approvals for house purchases increased to 58,200 in June from 56,600 in May but remained below the previous six-month average of roughly 61,400. Remortgage approvals rose to 34,200 from 33,800. Net mortgage borrowing jumped to £7.7 billion from £3.3 billion, while gross secured lending reached £27.4 billion.
At the same time, the effective rate actually paid on newly drawn mortgages rose to 4.35% from 4.22%. The rate on the outstanding stock increased to 3.96% from 3.92%. For borrowers, that means a lower purchase price can still produce a higher monthly housing cost if financing becomes more expensive.
Buyer Demand Remains Firmly Negative
The July survey from the Royal Institution of Chartered Surveyors put the net balance for new buyer enquiries at minus 28% for a second consecutive month. The measure represents the difference between respondents reporting rising and falling demand, so a negative figure indicates that declines remain more widespread. The series had reached minus 41% in March.
The agreed-sales balance was minus 30% in July, unchanged from the previous survey. Three-month sales expectations improved to minus 14%, while the 12-month measure stood at only plus 3%. The survey described the sales market as sluggish and said the latest readings still fell well short of signalling a meaningful recovery.
These measures offer a more immediate view of demand than completed-sale data. Buyer enquiries respond quickly to borrowing costs and confidence, while a transaction can take months to appear in official records.
Sellers Are Cutting Asking Prices More Aggressively
The more timely Rightmove index shows a considerably sharper adjustment in seller expectations. The average asking price of a newly listed home fell 2.0%, or £7,360, in August to £364,999. It was the largest August decline since 2018. Asking prices were also 1.0% below a year earlier, the steepest annual fall since December 2023.
The regional split has widened. Asking prices in northern England were 1.5% above last year, while the south was down 1.8%. London fell 4.4% in a single month and 3.1% year on year, with the average asking price around £646,000 and sellers taking an average 73 days to secure a buyer.
Supply remains unusually high. Agents had an average of 65 properties on their books in July, including homes under offer, matching a 12-year high for this time of year. The average two-year fixed mortgage rate stood at 5.09%, up from 4.95% a month earlier. The full-year forecast for average asking prices was cut to a range between zero and a 2% decline.
Asking prices and completed-sale prices measure different stages of the market. Sellers can reduce expectations immediately, while the official transaction index captures the eventual price only after the sale has completed and been registered.
Private Housing Data Point in the Same Direction
The research model published by Zoopla put annual house-price inflation at around 1.4%. During the four weeks to June 23, agreed sales were running roughly 7% below a year earlier and buyer enquiries were down about 15%. The company expected price inflation to ease toward 1% during the second half of the year.
Flats also remained the weakest part of that market. More than two-thirds of one- and two-bedroom flats listed since the start of the year had not secured a buyer by the time of the study. Activity was more resilient in northern England and Scotland and materially weaker in London and parts of southern England.
The forecast for 2026 as a whole was around 1.1 million completed sales, 6% to 8% fewer than in 2025. The methodology differs from the official index because it combines completed sale prices, mortgage valuations and recently agreed transactions, so small differences between headline rates are expected.
Rents Accelerate as Sale Prices Lose Momentum
Cooling house prices have not yet translated into lower housing costs for tenants. Average private rent reached £1,393 a month in July, £50 or 3.7% higher than a year earlier. Annual rent inflation had been 3.3% in June, making July the fastest increase since December 2025.
England averaged £1,451 a month, up 3.8%. Wales stood at £843 after a 4.5% increase and Scotland at £1,016 after a 1.7% rise. The latest observed Northern Ireland figure, for May, was £875, 2.3% above a year earlier. Cross-country comparisons require some caution because rental data collection differs in Scotland and Northern Ireland.
London remained the most expensive rental region at £2,317 a month, with annual growth accelerating to 3.0% from 2.2% in June. Kensington and Chelsea averaged £3,629, while Dumfries and Galloway recorded £554. Outside London, Oxford was among the most expensive areas at £1,966 a month.
The combination of weaker sale prices and faster rent inflation illustrates the continuing affordability problem. Households unable to qualify for or afford a mortgage remain in the rental market, where monthly housing costs are still increasing.
UK Housing Enters a Tougher Adjustment
By August, the market was sending several different signals at once. Completed-sale prices remained 2.0% above a year earlier nationally, but growth was slowing quickly. London and flats were already recording annual declines, sellers were cutting asking prices, available stock was unusually high and measures of buyer demand remained negative. Rents, meanwhile, were accelerating.
For investors, the national average is becoming a less useful guide to returns. With borrowing costs elevated, results increasingly depend on purchase price, financing structure, transaction tax, operating costs, property type and location. The contrast between still-growing northern regions and weaker, more expensive southern markets is becoming particularly important.
As experts at International Investment report, the current evidence does not support a nationwide housing-crash scenario, but it also falls well short of a normal recovery. The principal vulnerability is the combination of weak capital growth and expensive borrowing: a seller discount can be fully absorbed by higher mortgage payments, while the positive national index masks falling London values and weaker flats. If mortgage rates remain elevated and supply stays close to multi-year highs, nominal UK house-price growth could move toward zero without a dramatic crash, leaving inflation-adjusted values lower. For investors, that makes a strategy based primarily on broad capital appreciation increasingly fragile and raises the importance of net rental yield, taxation, financing costs and asset liquidity.
FAQ: UK House Prices in 2026
What is the average UK house price?
The official average was about £272,000 in June 2026. England averaged £293,000, Wales £213,000 and Scotland £195,000, while Northern Ireland averaged roughly £202,000 in the second quarter.
Are UK house prices falling?
The national index was still 2.0% higher year on year, but June recorded a 0.2% seasonally adjusted monthly decline. London and flats are already below year-earlier levels.
Why has UK house-price growth slowed so quickly?
The main factors are weaker current price growth, expensive mortgages and a base effect caused by the property-tax changes in spring 2025. Strong price rebounds in May and June last year are now making annual comparisons more demanding.
What is happening to London house prices?
The official average was about £554,000 in June, down 2.5% year on year. London has recorded ten consecutive months of annual declines, while asking-price data point to an even sharper adjustment in August.
What is the UK policy interest rate?
The policy rate stood at 3.75% after the July meeting. Six policymakers voted to hold, while three preferred an increase to 4.0%.
How expensive are UK mortgages?
The effective rate on newly drawn mortgages reached 4.35% in June. The average quoted two-year fixed rate used in the latest market data was about 5.09% in August.
How much is average UK rent?
Average private rent was £1,393 a month in July, 3.7% more than a year earlier. London averaged £2,317.
Are UK flats losing value?
Yes on the national official measure. The average flat or maisonette was 1.6% cheaper than a year earlier in June, while detached, semi-detached and terraced homes still posted annual gains.
What taxes apply to non-resident property buyers?
Non-resident purchasers in England and Northern Ireland usually face an additional two-percentage-point Stamp Duty Land Tax surcharge. Buying an additional home can normally add another five percentage points.
Is a UK housing crash likely?
Current nationwide data do not show a broad crash. They instead point to weak demand, falling prices in selected regions and property types, greater bargaining power for buyers and unusually high sensitivity to mortgage costs.