







 Alta Banka Collapse in Serbia: What Happens to Russian Depositors' Money
 Covivio Hotels Revenue Grows 4.7% as European Markets Split
 Lithuanian Apartment Prices Accelerate Across Major Cities
 Georgia's Tourism Revenue Hits Record High
 Norway's Sovereign Fund Commits €1.5bn to European Warehouses
 Market Rout of October 2026: Can Branded Hotels Protect Capital?
Travel Revenues Rise as Tourism Volumes Slow

Unsplash
The global travel industry is increasingly generating more revenue without a matching increase in travel volumes. In August 2026, the Skift Travel Health Index was unchanged from a year earlier. Global airline passenger traffic declined, while higher fares and hotel room rates supported revenue in parts of the industry. For hotel investors, the question is whether higher prices can keep earnings growing as travellers become more selective.
This is not evidence that every destination is losing visitors. Aviation, accommodation and short-term rentals show different trends across regions. Travel revenue reflects both prices and volumes, and neither an industry index nor passenger kilometres can substitute for an actual count of tourists.
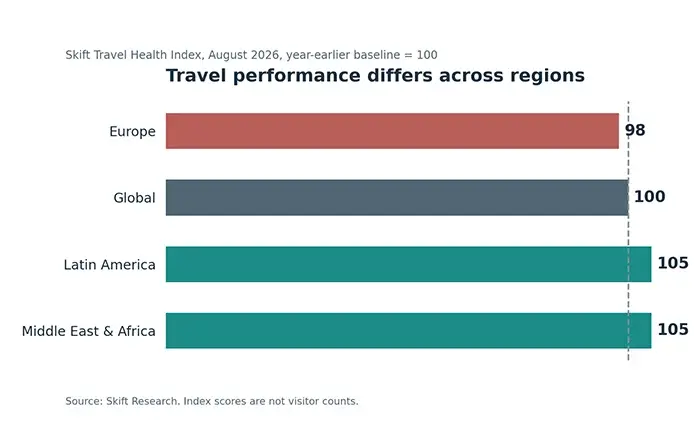
Skift's global travel index stands at 100
Skift's October analysis of its Travel Health Index highlights the growing divide between nominal spending and actual travel activity. The index measured 100 in August 2026, unchanged year on year. Europe stood at 98, while Latin America and the Middle East and Africa each reached 105. These are relative index readings, not visitor totals.
Payment data add a further distinction. Skift Research partner Nium reported air-ticket transaction value up 25% in Canada, 20% in Italy and 17% in Japan during January–August, while the UK contracted by 21%. These figures reflect transaction amounts, influenced by volumes, itineraries and prices; they cannot be presented as airfare inflation rates.
Global flying is weak, but the pattern differs by region
IATA reported a 0.8% year-on-year decline in worldwide revenue passenger kilometres in August 2026. International RPK fell 0.9%, capacity increased 0.3%, and the global passenger load factor reached 85.1%, down 0.9 percentage points. RPK measures passengers multiplied by distance flown, not distinct people taking holidays.
Middle Eastern airlines accounted for much of the contraction, reporting a 14.6% fall in traffic. Excluding the Middle East, global demand increased 0.6%. European airlines recorded 2.1% international growth, and the Europe–Asia corridor expanded 12.2%. The weak global result should not be described as an identical decline in every region.
Skift also reports jet fuel costs 52% above the prior year and July U.S. airfares up 26% in its monitored series. Such estimates are market- and period-specific and do not describe a uniform increase in average fares worldwide.
U.S. spending exceeds growth in travel volumes
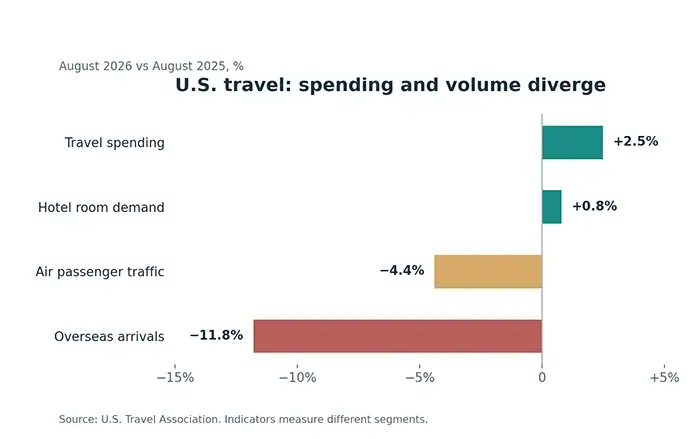
U.S. Travel Association data show August travel spending at $116.6 billion, up 2.5% year on year. Hotel room demand increased only 0.8%, passenger traffic in the association's series fell 4.4%, and overseas arrivals declined 11.8%. Each statistic measures a different population, but together they show that spending can grow even when important volume indicators weaken.
The U.S. Travel Price Index rose 7.4% in August compared with 3.4% for the overall consumer price index. Hotel RevPAR advanced 2%, although resort properties recorded a 3.5% decline. Higher total spending does not mean every travel business is earning more.
How can revenue rise as customer numbers fall?
Consider a simple illustration: a travel company serves 100 customers spending €100 each, giving it €10,000 in revenue. A year later, it serves 95 customers spending €110 each. Revenue rises to €10,450, a 4.5% gain, even though the customer count is down 5%. This is a hypothetical example, not observed market data.
Hotels use ADR for the average sold room rate, occupancy for the share of rooms occupied, and RevPAR for room revenue per available room. At €150 ADR and 70% occupancy, RevPAR is €105. Raising ADR to €165 while occupancy falls to 66% produces €108.90 RevPAR. But the hotel sells fewer room nights, and the calculation says nothing about its operating margin.
|
Metric |
What it measures |
What it does not show |
|
Skift index |
Composite sector trend |
Number of tourists |
|
RPK |
Revenue passenger-km |
Unique travellers |
|
Arrivals |
Recorded tourist entries |
Revenue or profit |
|
Transaction value |
Total payment amount |
Price change alone |
|
ADR |
Average sold room rate |
Occupancy |
|
RevPAR |
Room revenue per available room |
Operating profit |
STR raises its U.S. hotel outlook on pricing
STR and Tourism Economics raised their U.S. 2026 RevPAR growth forecast from 2.8% to 4.4%. ADR is forecast to increase 3.1% and room demand 1.7%, with occupancy broadly stable as supply expands. Demand earlier in the year and FIFA World Cup pricing effects helped lift the forecast.
Households earning $200,000 or more account for roughly one-quarter of U.S. travel spending despite representing only 11% of households. Premium operators can rely more on these customers, while value and economy hotels remain more exposed to pressure on household budgets.
The European picture should not be mixed into this forecast. For its separate sample of 31 European markets, STR expects just 1.2% RevPAR growth in 2026 and a slight decline in 2027. There is no single 4.4% worldwide hotel RevPAR forecast.
Higher prices reshape who can travel
Deloitte surveyed 4,003 Americans in April 2026 and found that only 45% planned a summer vacation involving paid accommodation, a six-year low. Those who did plan travel expected to spend an average of $4,069 on their main trip, 17% more than a year earlier. These are pre-season intentions, not actual nationwide travel receipts.
Respondents earning at least $100,000 were expected to account for 55% of prospective summer travellers, up from 50% a year earlier. More than half of Americans earning under $100,000 said travel was among the first expenses they would cut if household costs increased.
If lower-income customers drop out, average spending among those who still travel can rise simply because the traveller mix has become wealthier. That may protect receipts in the short term while narrowing the potential customer base.
Hotel revenue is not the same as hotel profit
Higher room rates do not automatically create higher earnings. Labour, utilities, maintenance, insurance, advertising and distribution fees absorb revenue. Skift notes that inflation-adjusted gross operating profit per available room, or GOPPAR, in the U.S. remains below its 2019 level.
A property can raise ADR while its margin deteriorates because guests stay fewer nights or costs outpace room-rate increases. Investors should therefore examine GOP, GOPPAR, refurbishment requirements and debt service in addition to RevPAR.
International Investment previously found that European hotel RevPAR rose 4.5% in H1 2026 and ADR increased 3.2%, but event calendars and operating expenses complicated the headline results. The latest travel-wide evidence expands that question from hotels to airlines and the wider tourism economy.
Affordability may shift destinations and accommodation
Price-sensitive travellers may choose shorter trips, shoulder-season dates, nearer destinations or alternative accommodation. Yet a cheap hotel room is not enough if international flights and local transport are expensive. Total trip cost matters more than any single tariff.
Skift Research reports continued growth in European vacation rentals and stronger September bookings in selected PriceLabs markets. These booking trends should not be treated as an increase in hotel demand across Europe; they represent another way traveller choices are changing.
For investors in mature destinations, improving the economics of existing hotels may be more reliable than building against nominal revenue trends alone. Direct bookings, efficient staffing, lower energy use and well-priced supplementary services can protect margins without adding rooms.
Can prices continue carrying the travel industry?
Pricing can sustain revenue while customers accept higher fares and room rates. There is no universal ceiling: premium guests, family travellers and business customers respond differently to cost increases. Yet each round of price increases risks reducing the number or duration of trips.
The evidence for August 2026 describes a divergent market: the Skift index was flat, airline RPK declined worldwide, and U.S. travel spending kept rising. None of those alone proves that fewer unique people travelled everywhere.
For tourism real estate, the durable measure is earnings after operating costs and financing. Price-led growth can work in selected segments, but dependence on ever-higher rates becomes less attractive if an expanding share of prospective customers can no longer afford the trip.
FAQ
Why can tourism revenue rise when visitor growth slows?
Higher tariffs, average spend and a wealthier customer mix can lift nominal turnover even with stable or falling volume. Visitor arrivals and room nights must be assessed separately.
What does a Skift Travel Health Index reading of 100 mean?
August 2026 industry performance matched the index level a year earlier. The reading is neither a visitor count nor total travel revenue.
Did global airline demand decline in August 2026?
IATA reports a 0.8% fall in worldwide RPK, although traffic excluding the Middle East increased 0.6%.
What is STR's U.S. RevPAR forecast?
It expects 4.4% growth in 2026, with ADR projected to rise 3.1%. This forecast is specific to the United States.
Why does higher ADR not guarantee profit growth?
Lower occupancy or faster-rising operating costs may offset revenue gains. GOP and GOPPAR help evaluate actual hotel performance.
Who is most affected by expensive holidays?
Deloitte's U.S. survey indicates that lower-income respondents are more likely to cut travel plans when household costs rise.
What should hotel investors analyse?
ADR, occupancy, RevPAR, annual room nights, GOP, cash flow, capital expenditure and the sustainability of demand at current prices.