







 Number of Foreigners Holding Turkish Residence Permits Exceeds 1.27 Million
 Demand from Russian Tourists for Holidays in Georgia Rises by 20–25%
 Montenegro Property Buying Costs in 2026
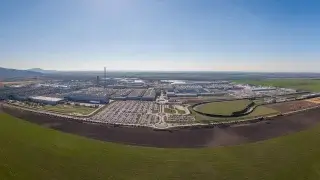 Four in Ten Companies Would Not Choose Slovakia
 Gulf Countries Prepare Unified Tourist Visa
 Latvia’s Foreign Tourism Slips in First Half
Australia’s Spring Auctions Rise but Remain Well Below 2025

Australia's spring property season has started with a seasonal rise in auction activity after winter, but volumes remain well below last year's levels. A total of 1,615 capital-city auctions were scheduled for the week ending September 13, up 12.9% from the previous week but 32.8% below the comparable period in 2025. The market is entering its busiest selling season with falling prices, expensive mortgages and more cautious buyers.
Auction volumes rise but remain far below last year
The number of homes scheduled for auction across Australia's capital cities increased in mid-September after a subdued start to spring. The comparison with last year, however, shows how much market conditions have changed.
There were 1,615 auctions scheduled for the week ending September 13, compared with 1,431 in the previous week. The equivalent week a year earlier recorded 2,402 auctions. The resulting annual shortfall was 32.8%, broadly matching the roughly 34% gap highlighted by Bloomberg.
The 1,615 figure represents scheduled auctions rather than a final count of completed events. Properties can sell before auction, be withdrawn or have their campaigns postponed, so final volumes may differ from the preview figures.
Melbourne accounts for much of the annual decline
Melbourne recorded the largest gap. There were 676 auctions scheduled for the week ending September 13, just 3% more than the previous week but 45.5% below the 1,240 recorded a year earlier.
Sydney was due to host 616 auctions. That represented a 23% weekly increase, although volumes remained 25.7% below the 829 recorded in the comparable week of 2025.
Brisbane moved in the opposite direction, with 169 auctions scheduled, 16.6% more than a year earlier. Perth, a much smaller auction market, also had more scheduled activity than in the corresponding week last year.
The previous week's final results provide a clearer measure of buyer demand. The combined capital-city clearance rate for the week ending September 6 was 49.3%, compared with 70% a year earlier. Of 1,431 auctions ultimately recorded, fewer than half returned a successful result. The final clearance rate had remained below 50% for ten of the preceding eleven weeks, according to Cotality.
Low auction volumes can normally help clearance rates because fewer properties are competing for buyers. That has not been enough in 2026. Vendors are taking substantially fewer homes to auction than a year ago, yet the proportion achieving a sale remains weak.
Australian home prices fall for a fifth month
The softer auction market is occurring alongside a broader price correction. PropTrack's national Home Price Index fell 0.2% in August, its fifth consecutive monthly decline. Prices were 2.7% below their March peak, although they remained 1.8% higher than a year earlier.
Capital-city prices dropped 0.3% during August and stood 3.6% below their peak. Regional prices were unchanged for the month and remained 6.6% higher year on year.
The correction has been deeper in Australia's two largest housing markets. Sydney prices fell 0.3% in August and were 4.9% below their peak, while Melbourne declined 0.2% during the month and stood 5.3% below peak levels. Sydney prices were 3.6% lower than a year earlier and Melbourne was down 4.3%. PropTrack attributes much of the weakening to higher interest rates reducing borrowing capacity and housing demand.
Australian housing indices use different datasets and methodologies, so estimates of the size of the downturn vary between providers. The broad direction is nevertheless consistent: values have moved lower in 2026, with the adjustment concentrated in the major capital-city markets.
The RBA cash rate stands at 4.35%
Borrowing conditions became tighter after the Reserve Bank of Australia resumed rate increases. The central bank raised its cash-rate target by 25 basis points in February, March and May, taking it from 3.6% at the end of 2025 to 4.35%.
The rate was left unchanged at the August 11 meeting, with the next decision scheduled for September 29. The Reserve Bank of Australia says financial conditions have tightened after the three increases and that the full effect of this year's monetary tightening has yet to pass through the economy.
For housing, the impact works through both borrowing capacity and repayments. Prospective buyers qualify for smaller loans at a given income, while higher mortgage costs reduce disposable income for existing borrowers. The effect is particularly important in expensive markets such as Sydney and Melbourne.
New mortgage lending declined in the June quarter
Housing-finance data also point to weaker demand. Australian lenders issued 134,225 new housing loans, excluding refinancing, in the June quarter, down 5.4% from the previous three months. Their total value fell 5.2% to A$97.6 billion.
Investor lending recorded the sharpest fall. The number of new investor loans declined 8.6%, while their value dropped 10.2%. Owner-occupier loan numbers fell 3.3%, and commitments to first-home buyers decreased 2.9%.
On the supply side, dwelling approvals fell 3.6% in July to 17,687. Private-house approvals declined 4.2% to 10,199, while approvals for private dwellings excluding houses slipped only 0.4% and remained 19.9% above their level a year earlier. The figures come from the Australian Bureau of Statistics' releases on housing lending and building approvals.
The data therefore do not point to a uniform contraction across every part of the housing market. Credit demand is weakening and capital-city prices are declining, while approval levels in some segments remain above a year earlier.
Buyers have more existing stock to choose from
The early spring market also contains an unusual supply pattern. New listings were subdued before September, but total advertised inventory had already moved above normal levels.
Just over 33,000 properties were newly listed during the four weeks to August 23, 8.2% below the five-year average and 2% below the same period in 2025. Total advertised stock, however, exceeded 137,000 properties, 1.7% above the five-year average.
The divergence can occur when properties take longer to sell and older listings accumulate. Buyers therefore have more advertised stock to choose from even as fewer owners launch fresh campaigns. Commonwealth Bank highlighted the same contrast ahead of the spring selling season.
Selling conditions have also become slower. Industry data for August showed a median time on market of 39 days, up from 28 days a year earlier, while the median vendor discount across the capitals widened to 4.2%. That gives buyers more time and, in many cases, greater scope to negotiate.
Tax changes will reshape future property investment
The federal tax package announced in May adds another consideration for residential investors. From July 1, 2027, full negative gearing of residential property will be limited to new builds.
Investors buying established housing after 7:30pm AEST on May 12, 2026 will still be able to deduct losses against other residential-property income and carry excess losses forward, but they will no longer be able to deduct those losses from unrelated income such as wages.
The government also plans to change the capital-gains tax treatment of gains accruing from July 1, 2027. Investors in new builds will be able to choose between the existing 50% capital-gains discount and the new arrangements. Investments held before the May announcement are protected from the negative-gearing changes, according to the Australian Treasury.
It would be too strong to attribute the current fall in investor lending solely to tax policy. The June quarter also included higher interest rates, reduced borrowing capacity and the beginning of a broader housing-price correction. The tax changes are another element investors now need to factor into purchases of established homes.
As International Investment experts note, the first weeks of spring show a seasonal rise in auction activity rather than evidence of a market recovery. Volumes remain about one-third below last year's levels, final clearance rates are around 50%, and prices in the largest cities are still declining. The next test will be whether the usual spring increase in supply is matched by stronger sales. If listings rise while demand remains constrained by a 4.35% cash rate and tighter borrowing conditions, pressure on prices and vendors could persist.
FAQ
How many auctions were scheduled in Australia in mid-September 2026?
There were 1,615 capital-city auctions scheduled for the week ending September 13, up 12.9% from the previous week but 32.8% below the comparable period in 2025.
What is Australia's current auction clearance rate?
The final combined capital-city clearance rate for the week ending September 6 was 49.3%, compared with 70% in the same week a year earlier.
Are Australian home prices falling?
PropTrack's national index fell 0.2% in August and stood 2.7% below its March peak. Prices were still 1.8% higher than a year earlier.
Which major cities have seen the largest corrections?
Sydney and Melbourne are among the weakest major markets. PropTrack placed prices 4.9% and 5.3% below their respective peaks.
What is the RBA cash rate?
The Reserve Bank of Australia's cash-rate target is 4.35%. It was increased three times in 2026 by a total of 75 basis points.
What is happening to Australian mortgage lending?
The number of new housing loan commitments fell 5.4% in the June quarter. Investor loan numbers dropped 8.6%, while owner-occupier loans declined 3.3%.
Do buyers have more choice in spring 2026?
Total advertised stock was above its five-year average ahead of spring even though the flow of new listings was below normal. Longer selling periods are allowing existing properties to accumulate on the market.