







 Covivio Hotels Revenue Grows 4.7% as European Markets Split
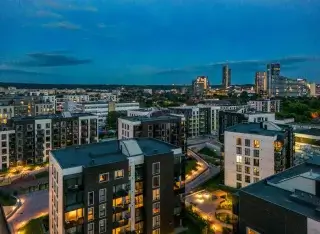 Lithuanian Apartment Prices Accelerate Across Major Cities
 Georgia's Tourism Revenue Hits Record High
 Norway's Sovereign Fund Commits €1.5bn to European Warehouses
 Market Rout of October 2026: Can Branded Hotels Protect Capital?
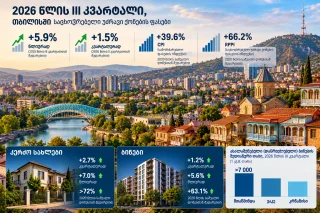 Residential Property Prices in Tbilisi Rise by 5.9% Year-on-Year
Housing Bubble Risks in 2026: UBS City Rankings

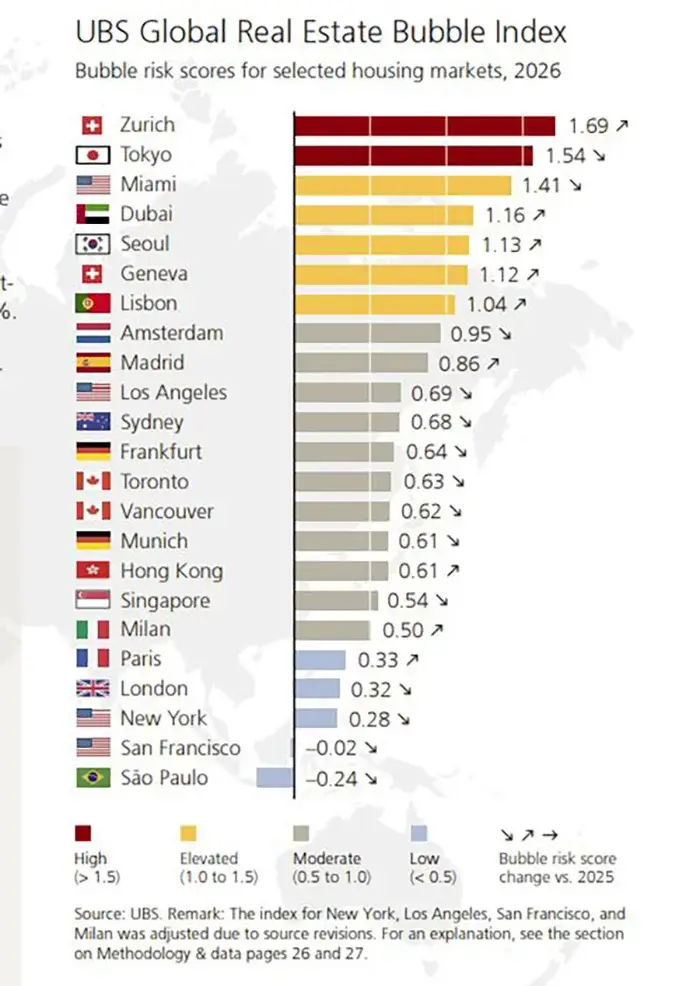
Swiss bank UBS assessed housing bubble risks across 23 major cities worldwide. The Global Real Estate Bubble Index 2026 examines imbalances between property prices, incomes, and rents, as well as mortgage lending and construction activity. Overall risks have changed little over the past year, but differences between individual markets are becoming more pronounced.
High-risk zone: Zurich and Tokyo
Only two cities fall into the high bubble-risk category in 2026. The underlying imbalances have different causes: one market is supported by extremely limited supply and resilient demand, while the other is becoming more vulnerable due to rapid price growth and worsening affordability.
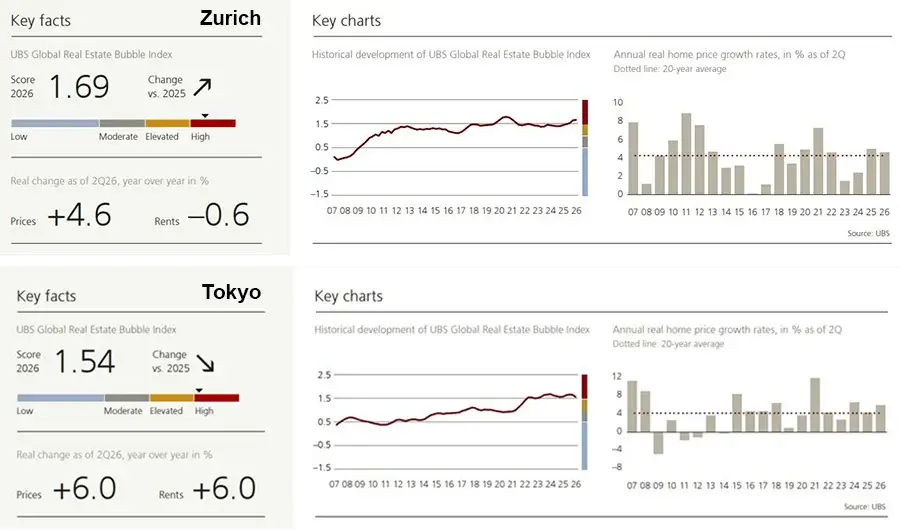
Zurich tops the ranking with a score of 1.69. Inflation-adjusted home prices in Switzerland’s largest city have risen by almost 140% over the past 20 years, compared with a 40% increase in rents and 30% growth in incomes. Over the past year alone, real property prices climbed another 4.6%, while rents fell by 0.6%.
Low interest rates and an acute shortage of supply continue to support the market. Vacancy rates are close to zero, while the number of owner-occupied homes listed for sale is roughly two-thirds lower than 20 years ago. Slower employment growth has so far had little effect on demand, while cheap financing has contributed to higher household debt.
UBS does not expect a significant price correction in the near term. Demand is supported by the city’s strong economy and an influx of skilled professionals, including those working in information technology and artificial intelligence. At the same time, the market is becoming increasingly dependent on persistently low interest rates. Zurich has the highest price-to-rent ratio of all cities in the study.
Tokyo ranks second with a score of 1.54. Over seven years, real home prices have risen by 50%—twice as fast as rents and roughly five times faster than incomes. Over the past year, both property prices and rents increased by 6% in real terms. The risk score has changed little compared with 2025.
Demand is supported by nominal income growth, international migration, and foreign investor interest in premium apartments in central Tokyo. However, high housing costs are already pushing some local buyers toward more affordable suburbs and rental properties. UBS experts believe Tokyo’s boom may be approaching its limits. A further increase in financing costs would reduce the investment appeal of homeownership and raise the likelihood of a correction.
Elevated risk in five cities
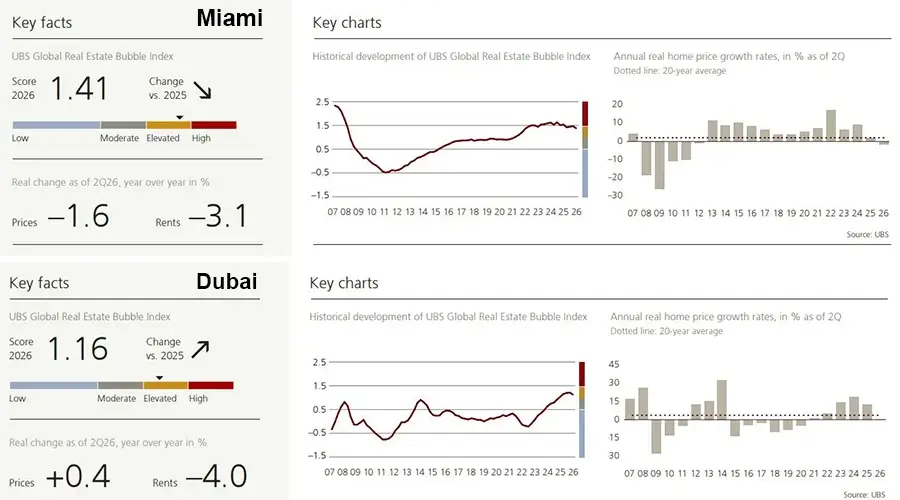
Five cities fall into the elevated-risk category. Miami is closest to the high-risk group, with a score of 1.41. Over the past 15 years, real home prices have tripled, while household incomes have increased by just 25%. The previous boom is now losing momentum: inflation-adjusted property prices fell by 1.6% over the past year and rents by 3.1%. High interest rates, rising insurance premiums, and additional costs for owners of older condominiums are weighing on demand. At the same time, a shortage of single-family homes and resilience in the luxury segment are limiting a broader decline.
Dubai follows with a score of 1.16. After real prices rose by more than 10% in 2025, the boom came to a halt: by mid-2026, property values had returned to previous levels, while inflation-adjusted rents declined. UBS notes that bubble risk remains elevated despite the cooling market. One of the main concerns is potential oversupply, although some projects have been delayed. At the same time, high rents make homeownership relatively attractive even with expensive mortgages, while Dubai’s role as a business hub continues to support demand.
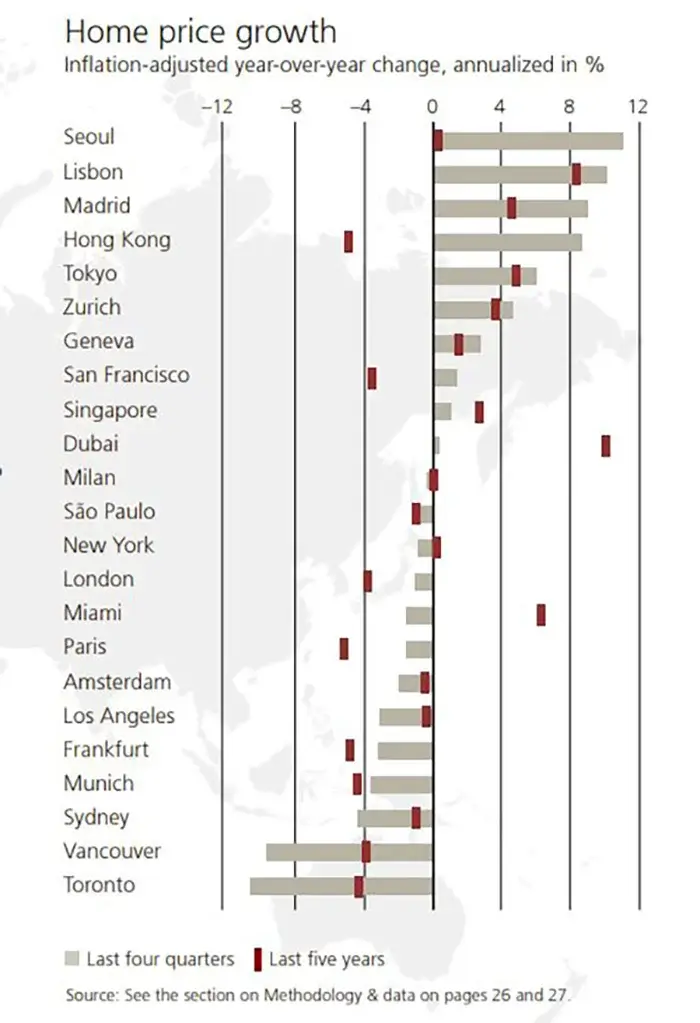
Seoul scored 1.13, with risks increasing alongside renewed price growth. Property values rose by 11% in real terms over the past four quarters—the strongest increase among all cities in the study—while rents gained 4.9%. The market began recovering in 2024 after an earlier downturn, and UBS now records one of the sharpest increases in imbalances in the ranking.
In Geneva (1.12), real prices rose by 2.7% over the year, while rents were virtually unchanged. Low financing costs continue to support demand, allowing imbalances to build. There are no clear signs of market cooling yet.
Lisbon (1.04) completes the elevated-risk group. Over the past decade, real prices have risen by an average of 6.6% annually, including a 10.2% increase in the latest year. This has sharply reduced affordability, making the Portuguese capital one of Europe’s most expensive housing markets relative to local incomes.
Moderate risk: from Amsterdam to Singapore
Ten cities fall into the moderate-risk category, with scores ranging from 0.54 to 0.95. Over the past year, accumulated imbalances have eased in many of them alongside price corrections. Madrid and Hong Kong stand out, with property values rising strongly and risks increasing.
Amsterdam is closest to the next category, with a score of 0.95. Homes became 2% cheaper in real terms over the year, while rents gained 2%. After a prolonged period of growth, the market is gradually moving away from peak valuations.
In Madrid, the index rose to 0.86. Real property prices increased by 9%, significantly outpacing rents, which gained 2.2%. Rapid appreciation is already changing demand patterns, with some buyers shifting toward more affordable suburbs.
In Los Angeles (0.69), prices fell by 3.2% after inflation and rents declined by 3.7%. Following decreases in both indicators, the UBS risk assessment is lower than in 2025. In Sydney (0.68), property values dropped by 4.4%, while rents declined by just 0.6%. Higher borrowing costs continue to constrain buyers and weigh on demand.
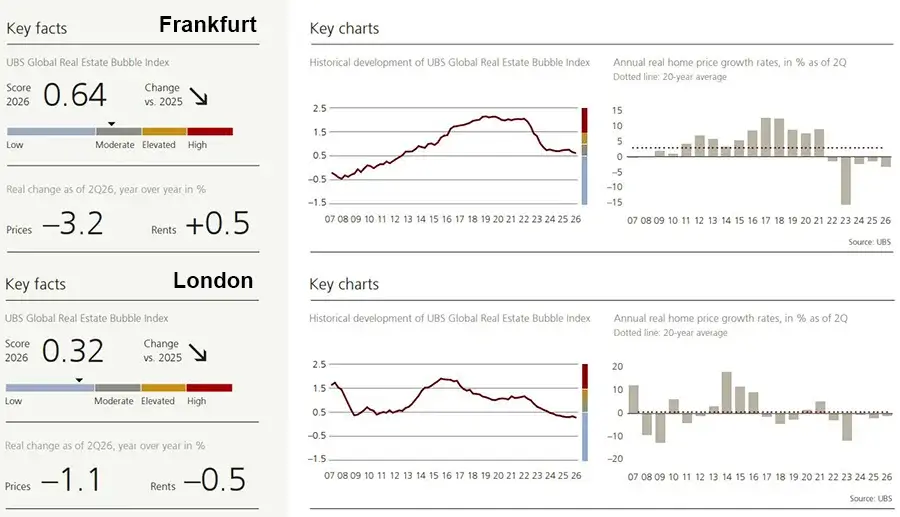
The correction is also continuing in Germany. Frankfurt scored 0.64 and Munich 0.61. Real prices fell by 3.2% and 3.7%, respectively. UBS notes that the effects of higher mortgage rates have not yet been fully reflected in property values.
The steepest declines were recorded in Canada. Toronto (0.63) lost 10.7% in real terms and Vancouver (0.62) 9.7%, while rents fell by 3.8% and 5%, respectively. In Hong Kong (0.61), a sharp recovery followed the previous downturn: property prices climbed 8.7% and rents 3.6%. Changes were much smaller in Singapore (0.54), where real prices gained 1% and rents edged down 0.1%. UBS does not identify a significant increase in vulnerability there.
Low risk: from Milan to São Paulo
Six cities are classified as low risk. In most of them, property prices either declined or changed little over the past year. However, a low UBS score does not mean housing has become affordable. In Paris, London, and New York, prices remain high relative to local incomes.
Milan sits on the boundary between the moderate- and low-risk categories with a score of 0.50. Real prices declined by 0.4%, while rents fell by 6.3%. Nevertheless, the risk assessment increased compared with 2025. In Paris (0.33), property values dropped by 1.6% after inflation and rents by 0.9%. The correction has continued for several years: over the past decade, real prices have fallen by an average of 0.5% annually.
London (0.32) also continues to become cheaper. Over the past year, property values fell by 1.1% and rents by 0.5%. Over ten years, real prices have declined by an average of 2.1% annually, although expensive housing and high borrowing costs continue to place a substantial burden on buyers.
In New York (0.28), prices fell by 0.9%, while rents rose by 1.2%. This has brought the relationship between buying and renting into better balance, although the ongoing costs of homeownership remain high.
In San Francisco, the index fell below zero to −0.02. Housing prices rose by 1.4% in real terms over the past year, while rents jumped 8.3%, the strongest increase among all cities in the study. UBS links this trend partly to an influx of wealth from the technology and AI sectors, particularly in the premium segment.
São Paulo (−0.24) ranks last. Property prices declined by 0.7%, while rents gained 1.1%. Its price-to-rent ratio remains among the lowest of the markets analyzed, but high borrowing costs continue to constrain housing affordability.
Buying a home on an average income
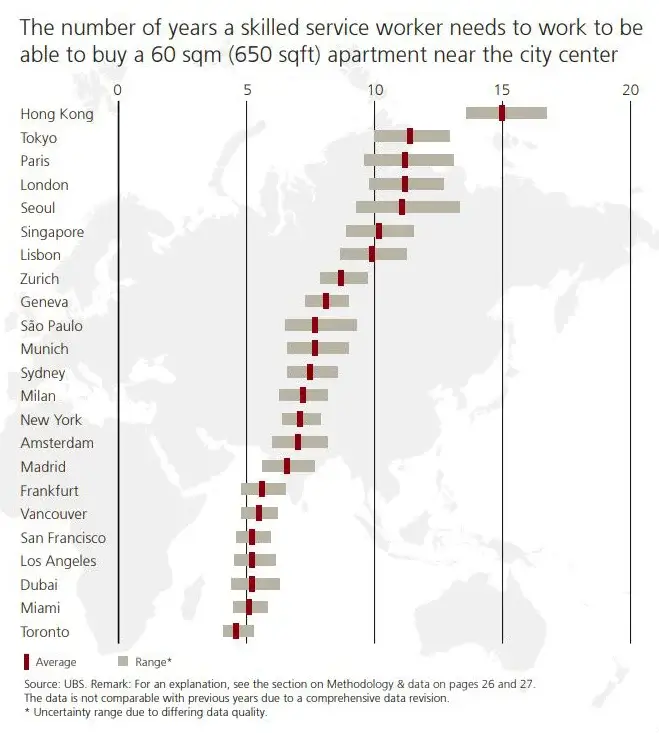
High property prices and more expensive borrowing have significantly reduced purchasing power. According to UBS, in most cities covered by the study, a skilled service worker on an average income would struggle to buy a 60-square-meter apartment near the city center. Compared with 2021, such a worker can now afford roughly one-third less living space.
Affordability is lowest in Hong Kong, where purchasing an apartment requires around 15 years of average income. A comparable home costs more than ten years of earnings in Tokyo, Paris, London, and Seoul as well. Housing also remains expensive relative to wages in Singapore, Lisbon, Zurich, Geneva, São Paulo, Munich, Sydney, Milan, and New York.
However, the price-to-income ratio tells only part of the story. Actual costs also depend on mortgage rates and repayment requirements. In the United States and Canada, property may appear more affordable relative to salaries, but high financing costs substantially increase monthly payments.
UBS highlights New York, Sydney, São Paulo, and London in particular. At current interest rates, prevailing price levels in these cities are becoming increasingly difficult to sustain on buyers’ incomes. Housing affordability can therefore deteriorate even in markets where bubble risk is classified as moderate or low.
Where renting is more attractive than buying
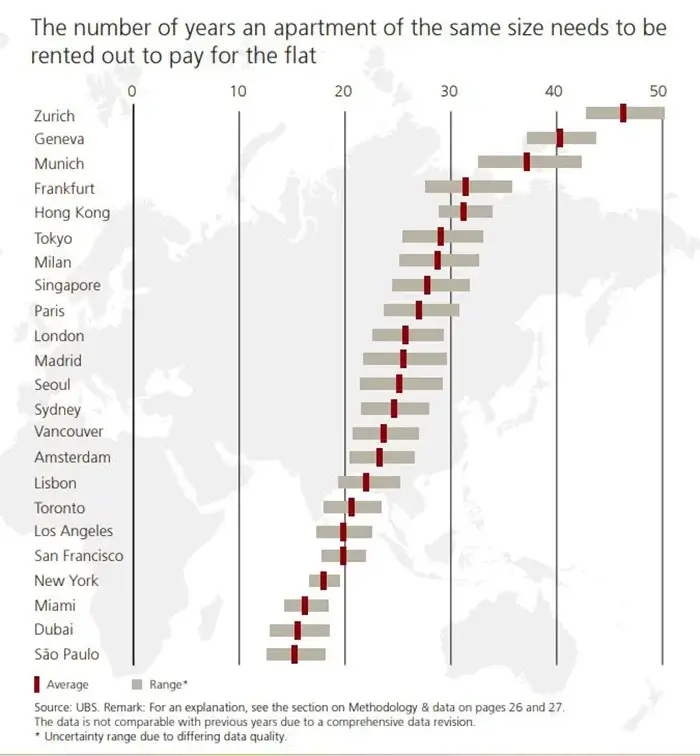
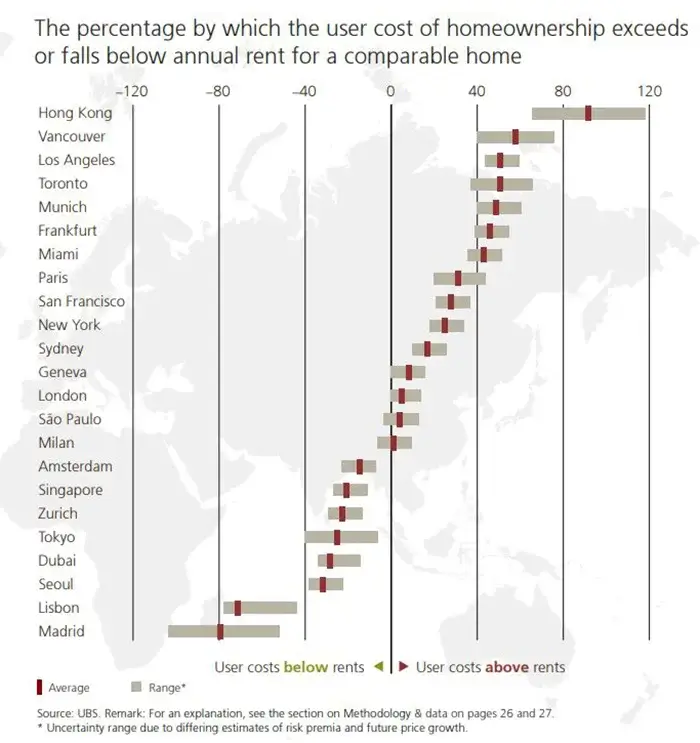
UBS compares apartment prices with the cost of renting equivalent properties. This measure helps assess whether buying makes financial sense. The wider the gap, the longer it takes for an owner to recover the purchase price through rental income and the greater the reliance on future property appreciation.
The largest gap is in Zurich, where the price of an apartment is equivalent to 46 years of rent. The figure reaches 40 years in Geneva and exceeds 30 in Munich, Frankfurt, and Hong Kong. At these levels, buying is difficult to justify on rental returns alone. Its investment appeal depends heavily on further price growth or lower interest rates.
The picture is very different in São Paulo, Dubai, and the US cities included in the ranking, where purchase prices are lower relative to rents. UBS attributes this to less regulated rental markets, high interest rates, and, in some markets, higher risk premiums.
The gap between buying and renting narrowed on average in 2022–2023 as higher interest rates changed investors’ return requirements. Since 2024, the ratio has remained broadly stable because property prices and rents have moved at similar rates in most cities. UBS experts believe that at current valuations, buying in many major cities makes financial sense primarily if property values continue to rise.
New factors are reshaping housing markets
UBS identifies accumulated wealth as an increasingly important driver of housing demand. Rising equity markets and investment in artificial intelligence have strengthened the purchasing power of affluent households. These buyers are more likely to purchase without a mortgage or rely less heavily on debt, making demand for expensive properties less sensitive to interest rates.
The trend is particularly visible in San Francisco and Seoul, where premium housing is outperforming the broader market. Additional demand is emerging in cities viewed by international investors as safe places to preserve wealth during periods of geopolitical uncertainty and inflation concerns. As a result, prices in the most sought-after areas can continue to rise even as homeownership becomes less affordable for local residents.
These changes make risk assessment more complicated. Price-to-income ratios remain an important benchmark but do not always reflect the purchasing power of buyers with substantial accumulated assets. At the same time, a high UBS score does not necessarily imply an inevitable price decline: in Zurich, for example, significant imbalances coexist with constrained supply and resilient demand.
International Investment analysts believe the UBS ranking should be viewed primarily as an indicator of accumulated vulnerabilities rather than a forecast of future price movements. For investors, the final score matters less than the factors behind it. Rapid price appreciation accompanied by weak rental growth, excessive new supply, or heavy reliance on borrowing creates one set of risks; limited construction, population inflows, and strong demand from cash-rich buyers create another.
The return on a specific property is equally important. High purchase prices combined with relatively low rents make an investment more dependent on future capital appreciation. Where purchase prices and rental rates are better balanced, returns rely less on continued market growth. Taken together, these factors provide a more complete picture of investment risk than a city’s position in the ranking alone.