







 Vietnam Mortgage Surge Pushes Homes Out of Reach
 Lithuanian Apartment Prices Accelerate Across Major Cities
 London Flats Lose Value Ahead of Leasehold Reform
 Construction of the Batumi–Sarpi Highway Begins in Georgia
 Baltic Property Investment Accelerates in 2026
 Hong Kong and Singapore Renew Their Expat Rivalry
US Housing Becomes a Buyer’s Market Without Buyers
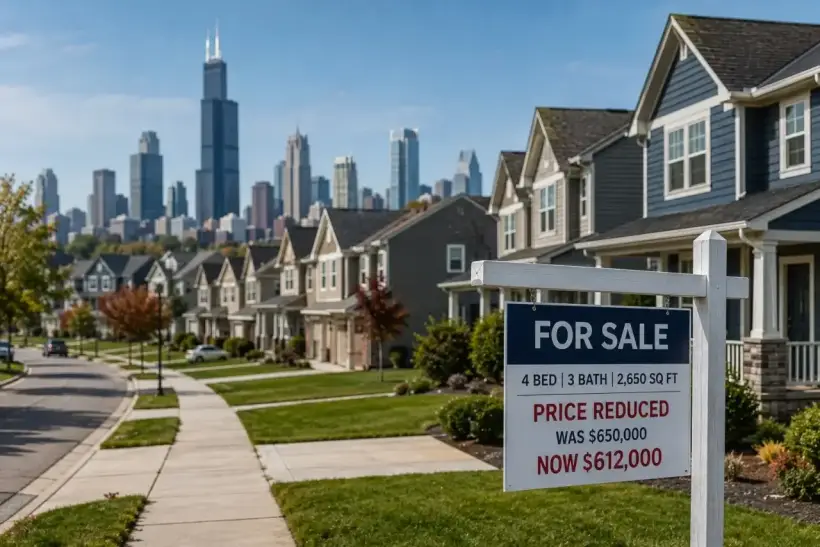
The U.S. housing market has entered an unusual phase in 2026: bargaining power has shifted toward buyers largely because the number of buyers has fallen to a record low. There were an estimated 966,752 active buyers in July compared with 1,462,921 sellers, leaving 51.3% more sellers than buyers. Thirty-nine of 49 major metropolitan markets qualified as buyer's markets, yet transactions have not recovered. The average 30-year mortgage rate remains close to 6.7%, completed-sale prices are still rising year over year and new contracts are weakening again. That contradiction between greater choice and disappearing effective demand is at the centre of an August 19 Bloomberg analysis.
The Buyer Pool Has Fallen Below One Million
The estimated number of active homebuyers dropped 2.5% from June to 966,752 in July, the lowest level in the series. Sellers also declined, but by only 0.3%, to 1,462,921.
That left 51.3% more sellers than buyers, up from 47.9% in June and just below the record 51.8% gap reached in December 2025.
Under Redfin's methodology, a market is classified as buyer-friendly when sellers outnumber buyers by more than 10%. A gap within 10% in either direction is considered balanced. Thirty-nine of 49 major metropolitan areas with sufficient data qualified as buyer's markets in July.
The terminology requires context. This is not primarily a story of booming supply. Seller numbers are also falling; buyers are simply dropping out much faster.
Miami and Texas Offer Buyers the Most Leverage
The largest imbalances are concentrated in several former pandemic boom markets.
Miami had roughly 154% more sellers than buyers. Nashville followed at 151%, Houston at 130%, San Antonio at 116% and Austin at 112%.
These markets experienced rapid migration, price appreciation and homebuilding during the pandemic period. Higher financing costs subsequently weakened effective demand while a relatively large amount of housing remained available.
Parts of the Northeast and Midwest remain much tighter because long-term construction has been more limited.
The national buyer's-market label therefore masks increasingly large differences between individual U.S. cities.
Existing-Home Sales Are Falling Again
Greater negotiating leverage has not triggered a wave of transactions.
Existing-home sales fell 1.7% from June to a seasonally adjusted annual rate of 4.06 million in July. Sales were only 0.7% higher than a year earlier.
The median existing-home transaction price reached $434,100, up 2% year over year and marking a 37th consecutive annual increase.
Unsold inventory stood at about 1.54 million units, equivalent to 4.6 months of supply at the current sales pace. First-time buyers represented only 29% of transactions, down from 33% in June.
The figures come from the National Association of Realtors' existing-home sales data.
The U.S. therefore has considerably more buyer choice than during the extreme shortages of the pandemic boom, but not a nationwide inventory glut large enough to force a rapid price collapse.
Pending Contracts Point to Further Weakness
The forward-looking sales measure deteriorated more sharply.
Pending existing-home sales fell 2.3% from June and 2.2% from a year earlier in July, reaching their lowest level since January 2026.
Contract signings declined month over month in every major region: 4.7% in the West, 2.2% in the South, 2% in the Northeast and 0.7% in the Midwest.
Pending contracts are now roughly 30% below their 2019 pre-pandemic level even though U.S. payroll employment is about 5% higher.
That gap points to substantial potential housing demand that is not being converted into purchases under current affordability conditions.
A 6.67% Mortgage Rate Remains a Major Barrier
As of August 13, the average conventional 30-year fixed mortgage rate was 6.67%.
That was marginally below 6.69% the previous week but above the 6.58% rate recorded a year earlier. The 15-year fixed mortgage averaged 5.96%.
The figures were published by Freddie Mac.
For a mortgage of several hundred thousand dollars, the difference between today's borrowing cost and the roughly 3% rates available during the pandemic translates into a substantial change in the monthly payment.
A buyer can therefore negotiate several percentage points off an asking price and still face a far higher monthly housing cost than someone who bought the same property several years earlier.
Almost Half of Existing Mortgages Carry Rates of 4% or Less
High current rates also constrain the seller side of the market.
In the first quarter of 2026, 19.5% of outstanding mortgages had rates below 3%, while another 30.4% were between 3% and 4%. Combined, 49.9% carried rates of 4% or less.
A total of 77.9% of outstanding mortgages were below 6%. Only 22.1% carried rates of 6% or higher.
A record 41.2% of loans were between five and seven years old, reflecting the large volume of mortgages originated or refinanced during 2019-2021.
The calculations in Realtor.com's mortgage analysis are based on the Federal Housing Finance Agency's National Mortgage Database.
For an owner paying 3% on a fixed-rate mortgage, moving can mean giving up unusually cheap debt and taking out a new loan at more than twice the interest rate.
That lock-in effect allows many owners to reject low offers or withdraw from the market rather than sell quickly.
One in Five Listings Has Already Had a Price Cut
Pricing pressure is nevertheless becoming more visible in advertised homes.
The national median list price was $428,950 in July, 2.4% lower than a year earlier and the ninth consecutive annual decline. Median list price per square foot fell 2%.
Price reductions appeared on 20% of active listings. The share reached 21.9% in the West and 21.3% in the South.
Austin posted the largest year-over-year decline in list price per square foot among the 50 largest metros at 8.5%, followed by Memphis at 6% and Tampa at 4.8%.
Active inventory totalled about 1.126 million listings, 2.1% more than a year earlier but still 11.6% below typical 2017-2019 levels.
The market has therefore become buyer-friendly mainly because demand has fallen faster than supply, not because the U.S. suddenly has an enormous housing surplus.
Affordability Is Above Its Technical Threshold
The fixed-rate Housing Affordability Index stood at 103.3 in July, up from 101.8 in June but below 112 in March.
A reading of 100 means a median-income family theoretically earns exactly enough to qualify for a mortgage on a median-priced home under the index assumptions. A value above 100 indicates an income cushion.
The methodology, published by the Federal Reserve Bank of St. Louis, assumes a 20% down payment.
That assumption is crucial. Twenty percent down on a $400,000 home requires roughly $80,000 before closing costs, insurance and moving expenses.
An index above 100 therefore does not mean a typical younger household can easily enter the market.
New Homes Give Buyers Even More Room to Negotiate
The imbalance is particularly visible in newly built single-family homes.
June sales ran at a seasonally adjusted annual rate of 628,000, 1.6% above the revised May rate but 5.6% below June 2025.
About 485,000 new homes remained for sale at month-end, representing 9.3 months of supply at the current sales pace.
The median new-home sale price was $398,300, down 2.7% year over year. The average price fell 6.5% to $475,400.
Those figures come from the U.S. Census Bureau's new-home sales report.
Builders have more flexibility than individual homeowners to reduce the effective cost of a transaction. They can cut prices, buy down mortgage rates, pay closing costs or provide upgrades.
Single-Family Construction Has Slowed Sharply
Large inventories are already changing builders' future production decisions.
Total privately owned housing starts fell 12.4% from June in July to a seasonally adjusted annual rate of 1.239 million, 13.5% below the July 2025 level.
Single-family starts declined 9.9% from June to an annual rate of 808,000.
Permits moved in the opposite direction. Total authorizations rose 5% to 1.443 million, while single-family permits increased 2.5% to 894,000.
The divergence suggests caution rather than a complete retreat. Builders are continuing to prepare projects but are less willing to break ground while unsold inventory remains high.
A prolonged reduction in starts could eventually recreate supply shortages after the current adjustment.
Builders Remain Deeply Cautious
The latest builder-confidence reading available when the Bloomberg analysis was published was 34 for July.
Any reading below 50 means more builders view market conditions as poor than good. The index had remained below 40 for 15 consecutive months, the longest such period since 2012.
According to the National Association of Home Builders, 37% of builders cut prices in July, up from 35% in June and 32% in May. The average reduction was 6%, while 63% used some form of sales incentive.
The index for current sales conditions stood at 37, expectations for the next six months at 43 and prospective buyer traffic at just 23.
Even companies able to offer discounts and subsidized financing are therefore not seeing a broad return of demand.
Asking Prices and Completed Sales Are Moving Differently
A defining feature of the 2026 market is the divergence between advertised prices and completed-sale prices.
The national median list price fell 2.4% year over year to $428,950 in July, while the median price of an existing home actually sold rose 2% to $434,100.
The difference partly reflects changes in the mix of homes being marketed and sold, but it also illustrates seller behavior.
A homeowner can reduce an asking price and still reject the final offer. Because most U.S. mortgages have long-term fixed rates, a rise in current borrowing costs does not force existing borrowers to refinance.
That allows the market to adjust for a long time through fewer transactions rather than through a sudden nationwide repricing of the entire housing stock.
A Buyer’s Market Is Not Yet an Affordable Market
Qualified buyers now have more properties to choose from, fewer competing bidders and more opportunities to negotiate price, repairs, closing costs and other concessions.
But the reason they have gained that power is precisely what makes the market fragile.
The buyer count is at a record low, pending contracts are falling, first-time buyer participation remains limited and mortgage rates are close to 6.7%.
The current environment is therefore better described as a market with strong buyer negotiating leverage but weak purchase affordability.
As International Investment experts report, the central mistake would be to equate a buyer's market with cheap housing. A 51.3% seller surplus creates meaningful negotiating opportunities, particularly in Miami, Austin, Houston and other Sun Belt markets. But the record-low buyer count shows that the leverage largely comes from demand destruction. A discounted property remains unaffordable when its mortgage payment does not fit the household budget. A durable housing recovery would require lower financing costs, stronger contract activity and a meaningful return of first-time buyers at the same time. Until that happens, the U.S. can remain in an unusual equilibrium where sellers increasingly need to compromise while millions of potential buyers still cannot take advantage of those concessions.
FAQ: U.S. Housing Market in 2026
Is the United States really a buyer’s market?
Yes, under Redfin's methodology. Sellers outnumbered buyers by 51.3% in July, and 39 of the 49 major metros analyzed qualified as buyer's markets.
How many active homebuyers are there?
There were an estimated 966,752 active buyers in July compared with about 1.463 million sellers.
Why are so many buyers staying out of the market?
The main obstacles are high home prices, mortgage rates around 6.7%, large down-payment requirements and broader economic uncertainty.
Are U.S. home prices falling?
It depends on the measure. The median national asking price was 2.4% lower year over year in July, while the median price of existing homes actually sold was still 2% higher.
Where do buyers have the most leverage?
The strongest buyer-friendly conditions were recorded in Miami, Nashville, Houston, San Antonio and Austin.
Why are homeowners not cutting prices more aggressively?
Almost half of outstanding mortgages still carry rates of 4% or less. Many owners can postpone a sale rather than surrender a low fixed mortgage and accept a large discount.
What is happening in the new-home market?
About 485,000 new single-family homes were for sale at the end of June, equivalent to 9.3 months of supply. Builders are using price reductions and incentives to attract buyers.
Is U.S. homebuilding slowing?
Yes. Total housing starts fell 12.4% month over month in July, while single-family starts dropped 9.9%.
What could bring buyers back?
A sustained decline in mortgage rates would have the strongest immediate impact. Slower home-price growth, continued income growth and a recovery in first-time buyer activity would also improve demand.