
 Fed Split Revives Threat of Higher Rates
 Reviews Expose Argentina’s Tourism Weaknesses
 Bank Indonesia Expands Support for Rupiah
 Central Banks Return to Gold After Weak Start
 Dubai Real Estate Market Slows Amid Middle East Conflict
 Egypt launches digital visa-on-arrival system at Cairo International Airport
Belgian housing prices kept rising

Belgian home prices rose at the end of 2025
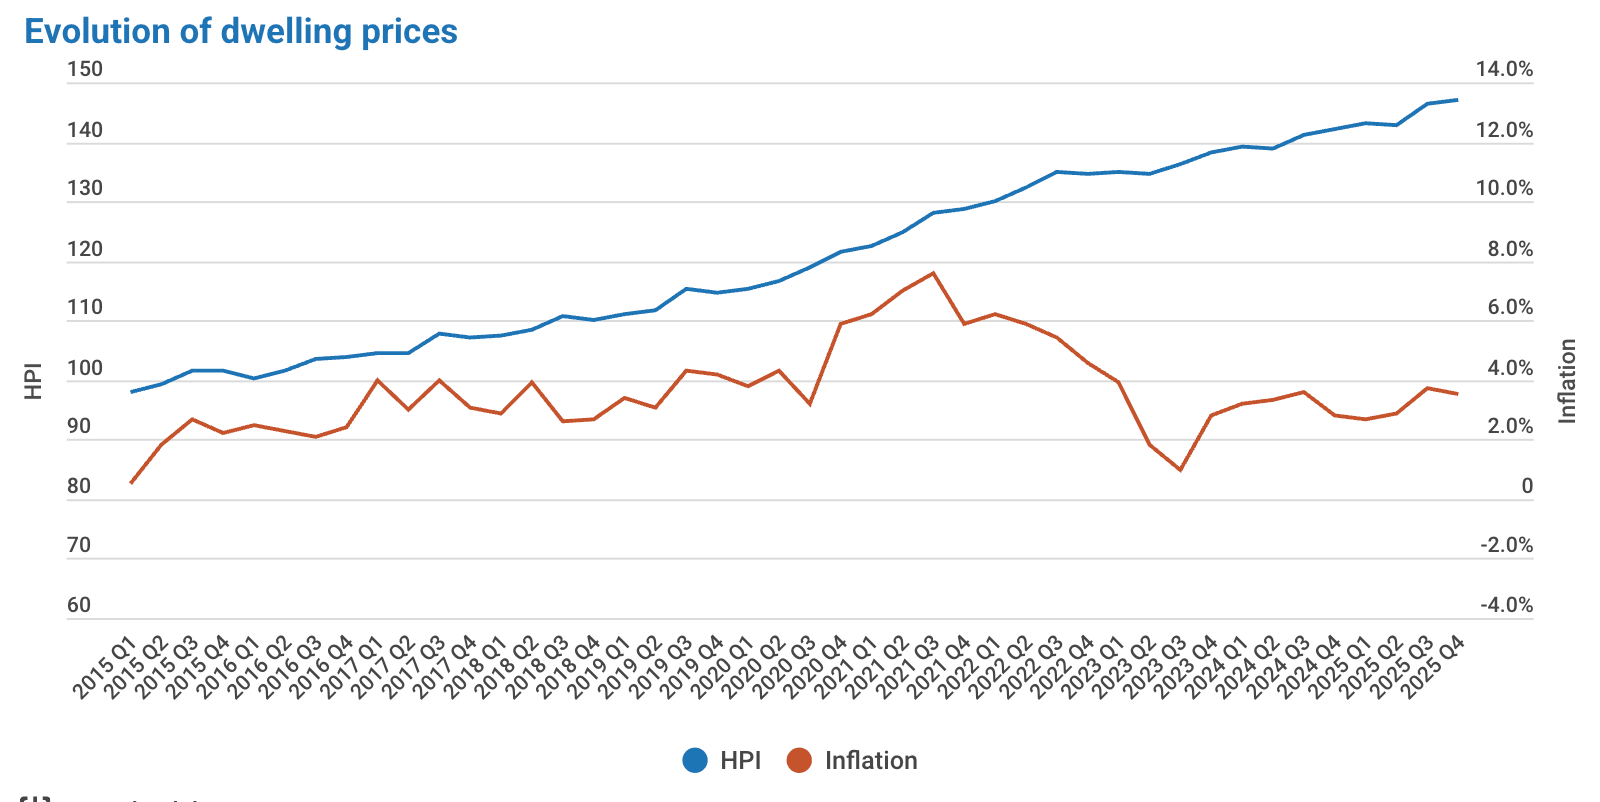
Belgium’s housing market ended 2025 in positive territory, with official data showing continued but moderate price growth. According to Statbel, the Belgian statistical office, annual house price inflation reached 3.5% in the fourth quarter of 2025, slightly below the 3.7% recorded in the previous quarter. The average inflation rate for the full year stood at 3.2%, while the house price index itself rose to 147.10 points on a 2015=100 basis, up 0.5% from the third quarter.
Statbel data pointed to resilience rather than overheating
The latest release suggests a market that is still moving upward without showing signs of an abrupt surge. Statbel notes that the index is calculated under a harmonised European methodology, allowing direct comparison across European Union member states. That matters because the indicator is designed to capture the underlying evolution of comparable housing prices rather than changes in the average value of all transactions.
What Belgium’s house price index actually measures
The index tracks price changes for residential real estate purchased by households, regardless of whether the asset is bought for owner-occupation or for letting. Statbel explicitly says the measure assumes that the characteristics of the sold property remain unchanged. To do that, it uses a hedonic model, a statistical approach that filters out differences in size, type and quality across homes sold in different periods. As a result, the series should not be read as a simple measure of the average sale price in the market.
Existing homes outpaced new-build houses
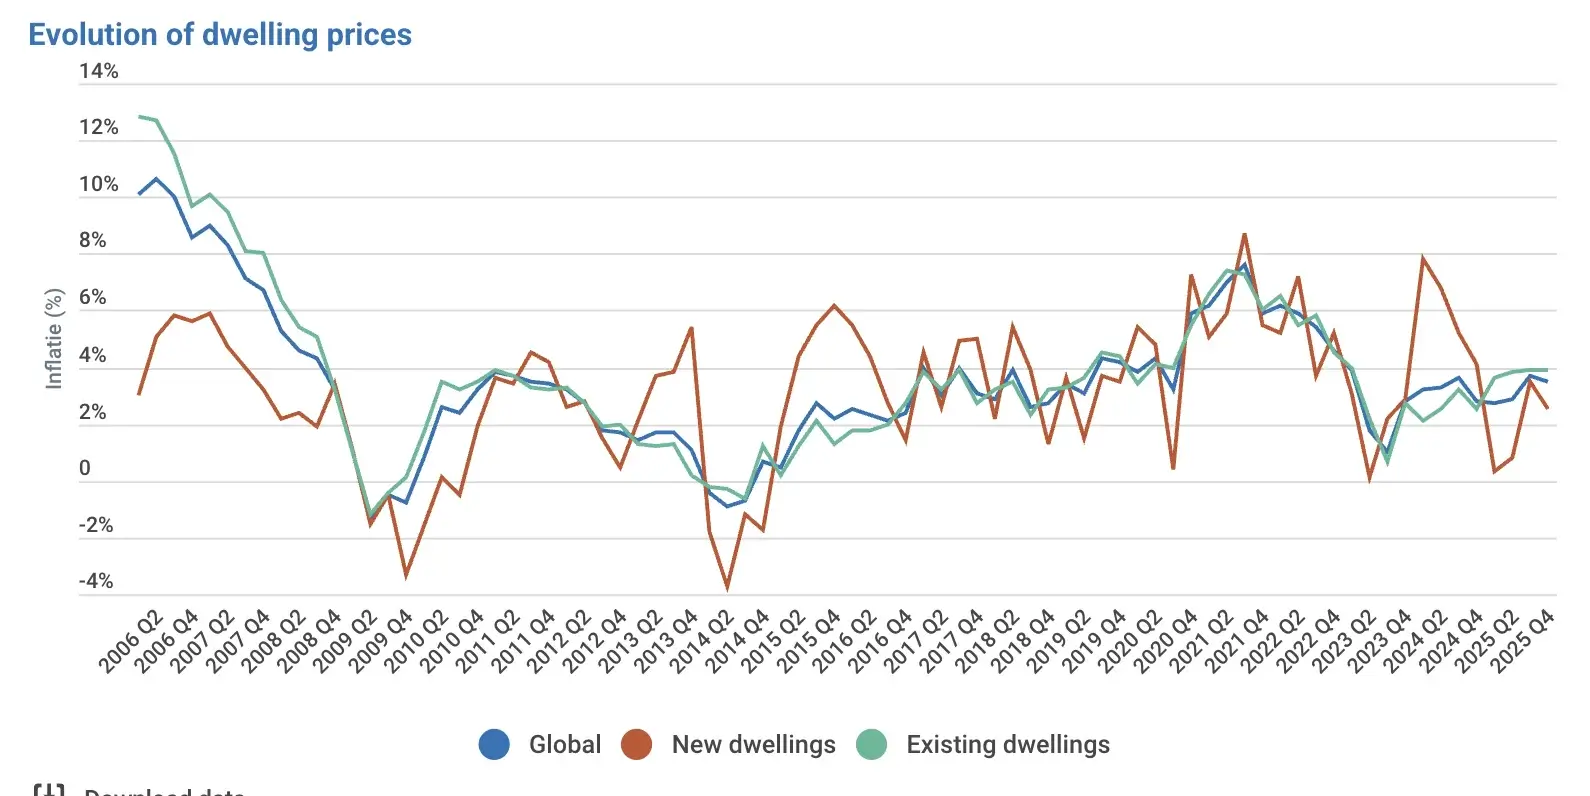
One of the clearest takeaways from the report is the gap between the primary and secondary segments. In the fourth quarter of 2025, annual inflation amounted to 2.5% for new houses and 3.9% for existing houses. Existing homes also carried much greater weight in the overall index, accounting for 70.4% of the basket in 2025, versus 29.6% for new houses. That means the national reading was driven primarily by the resale market rather than by newly built housing.
Wallonia led the regional price growth
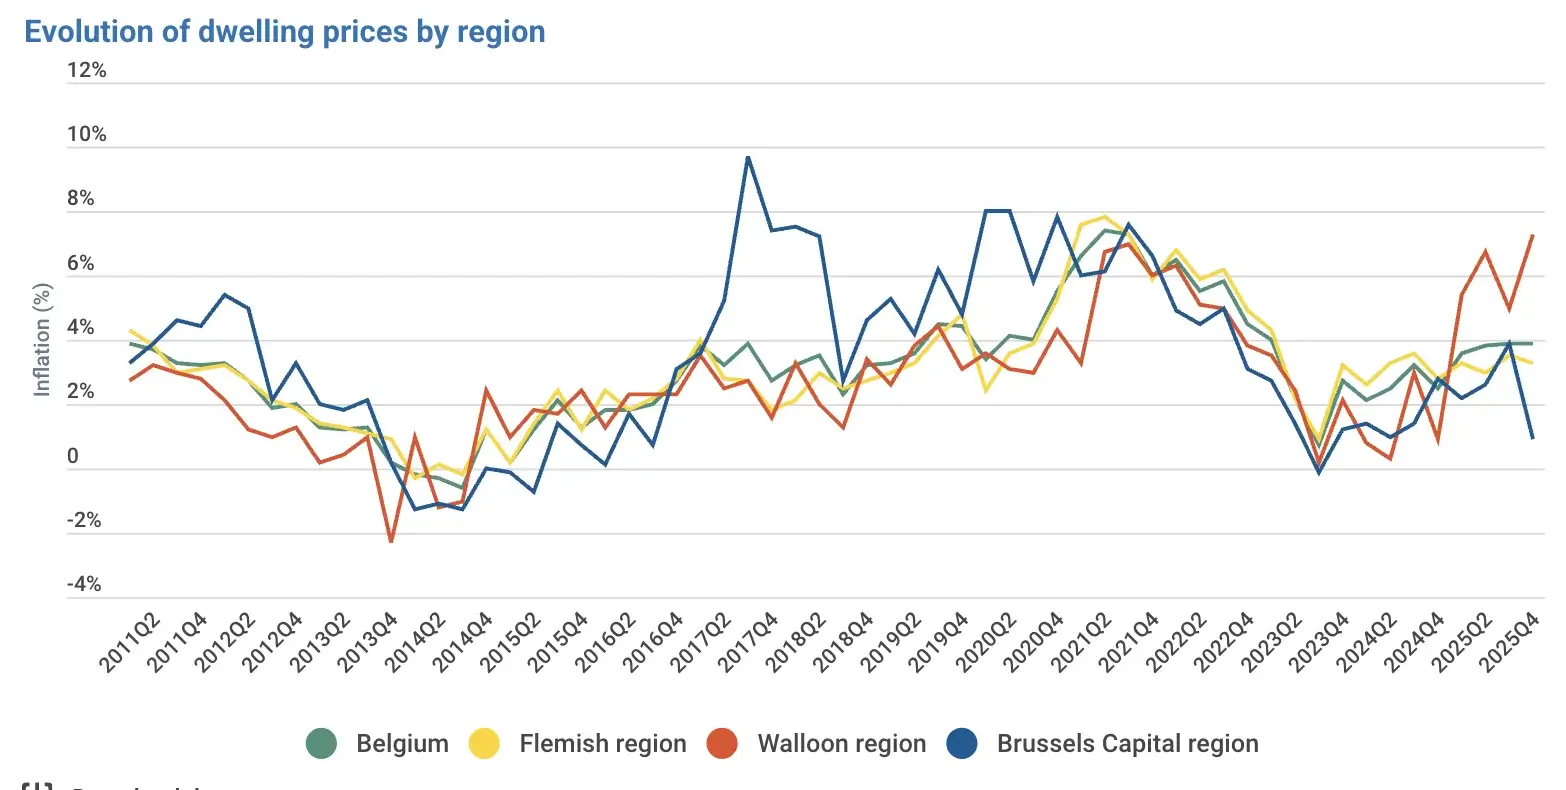
Belgium’s regional picture was far from uniform. For existing houses, Statbel reported annual price inflation of 0.9% in Brussels, 3.3% in Flanders and 7.3% in Wallonia in the fourth quarter of 2025. The spread shows that the national number masks substantial regional variation. Brussels posted the softest increase, while Wallonia emerged as the fastest-growing regional market in the latest quarter.
Belgium outperformed France and slightly topped Germany
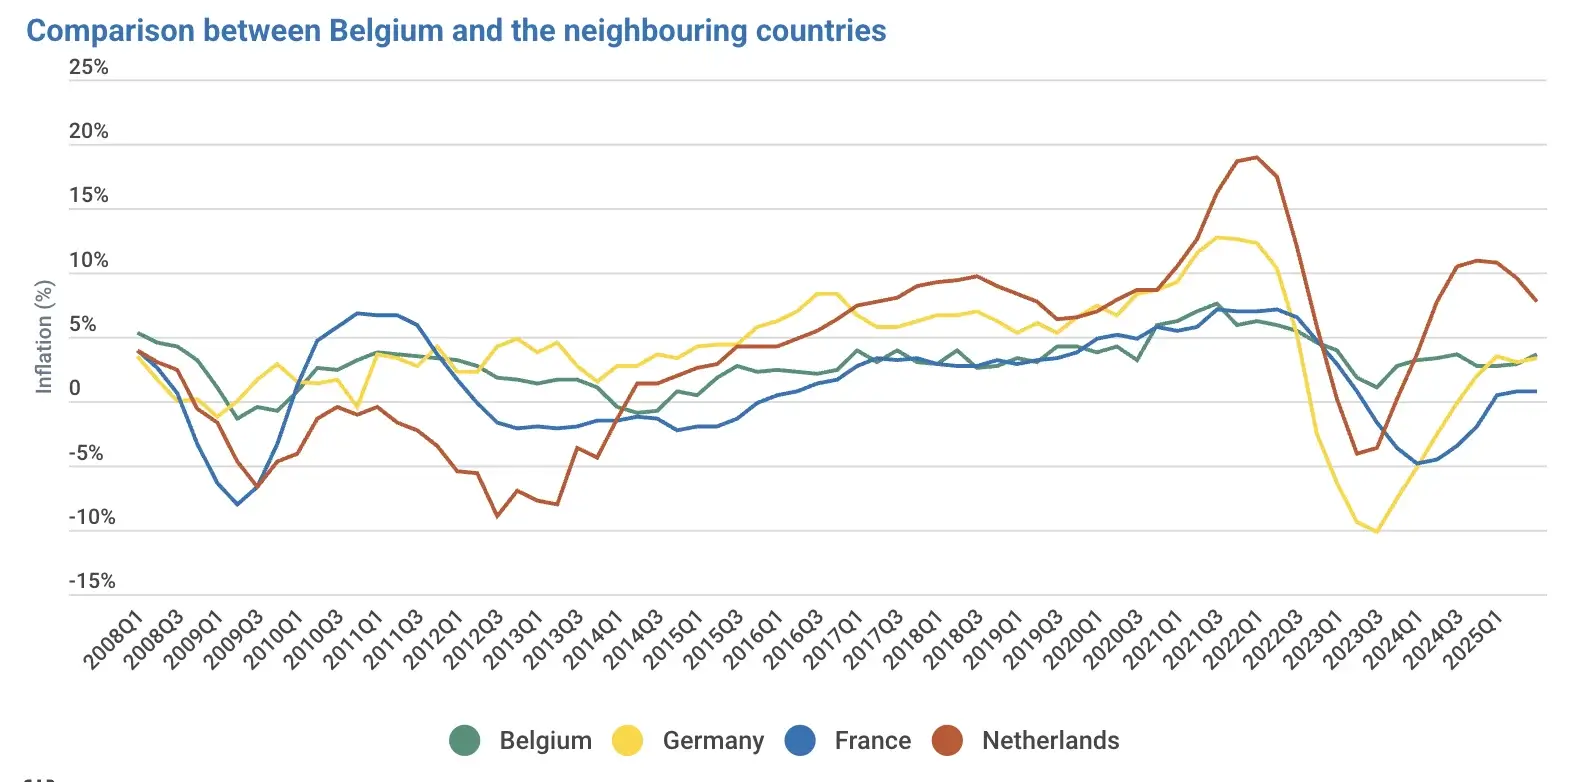
For cross-border comparison, Statbel relied on third-quarter 2025 data because Eurostat, the statistical office of the European Union, had not yet published neighbouring countries’ fourth-quarter readings at the time of release. On that basis, Belgium recorded annual house price inflation of 3.7%. The Netherlands posted 7.7%, France 0.7%, Germany 3.3%, while the euro area as a whole stood at 5.1%. This places Belgium above France and slightly above Germany, though still well below the pace seen in the Netherlands.
Why the latest figures may still be revised
Statbel says the data for the most recent two quarters are provisional. That means the fourth-quarter 2025 figures may still be adjusted in later publications as more transaction information becomes available. The index is based on real estate transaction data from the General Administration of Patrimonial Documentation of Belgium’s Federal Public Service Finance. For the market, that caveat is important: the current reading is already strong enough to define the trend, but it is not yet final.
Belgium entered 2026 without a market reversal
The latest numbers do not point to a downturn or to a renewed acceleration. Instead, they show a market that kept advancing at a measured pace, with resale housing remaining the main driver and regional divergence becoming more visible. For buyers, sellers and investors, that suggests Belgian residential property was still gaining value at the turn of 2026, but increasingly in a way shaped by geography and market composition rather than by a single nationwide trend.
As International Investment experts note, the Statbel release points to stable but not overheated growth in Belgian housing prices. The most important signals for the market are the stronger performance of existing homes relative to new builds, the sharp regional outperformance of Wallonia, and Belgium’s firmer position compared with France, alongside a broadly similar pace to Germany.
FAQ
What did Belgium’s latest house price index show?
Statbel said annual house price inflation reached 3.5% in the fourth quarter of 2025, while the index increased 0.5% from the previous quarter.
Why is the house price index different from the average transaction price?
Because the index is adjusted for property characteristics through a hedonic model, which helps isolate pure price change rather than shifts in the mix of homes sold.
Which segment rose faster, new or existing homes?
Existing homes rose faster. Annual inflation was 3.9% for existing houses and 2.5% for new houses in the fourth quarter of 2025.
Which Belgian region saw the fastest increase?
Wallonia recorded the strongest annual growth for existing homes, at 7.3% in the fourth quarter of 2025.
How did Belgium compare with nearby countries?
Using third-quarter 2025 comparison data, Belgium outperformed France and slightly exceeded Germany, but remained well behind the Netherlands.