







 Covivio Hotels Revenue Grows 4.7% as European Markets Split
 Lithuanian Apartment Prices Accelerate Across Major Cities
 Georgia's Tourism Revenue Hits Record High
 Norway's Sovereign Fund Commits €1.5bn to European Warehouses
 Market Rout of October 2026: Can Branded Hotels Protect Capital?
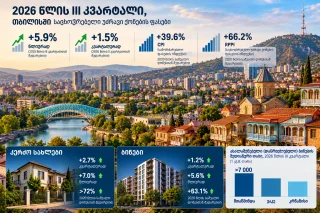 Residential Property Prices in Tbilisi Rise by 5.9% Year-on-Year
EU Construction Rises While Building Output Keeps Falling

Europe’s construction industry regained momentum in August 2026, but the improvement did not extend to the construction of buildings. Output across the European Union rose 2% from July, even as building construction fell 1%. The annual figures expose a wider divergence: total construction production increased 2.6%, while output in building construction was 4.1% below its August 2025 level. For property investors, the distinction matters more than the headline rebound.
The figures come from Eurostat’s 20 October release on August construction production. Across the euro area, overall output rose 1.8% month on month and 1.4% year on year. Monthly changes are seasonally and calendar adjusted, while annual comparisons are calendar adjusted. The measure tracks construction activity, not housing completions or the number of apartments delivered.
Specialised Work Drives the Rebound
Construction production combines the building sector, civil engineering and specialised construction activities. The last of these accounted for the strongest monthly gain in August, rising 2.3% in the EU and 2.5% in the euro area. Building construction, by comparison, fell 1% and 0.4% respectively, while civil engineering declined by 0.2% in the EU and 2.1% in the euro area.
The annual figures reinforce the split. EU building construction output was down 4.1%, despite gains of 2.9% in specialised construction and 2.8% in civil engineering. A rising aggregate index can therefore coexist with weakness in the segment most directly associated with new residential and commercial buildings. Even then, building output is not a housing-only measure: the release does not identify how many apartments were completed, where they are located or when they will reach the market.
Romania Leads While France and Spain Contract
National changes were strikingly uneven. Hungary recorded the largest monthly increase in August at 14%, followed by Germany at 9.3% and Romania at 7.2%. Slovenia registered a 5.1% monthly decline, Slovakia 4.9% and Italy 2.9%. These are changes in activity over a single month, not evidence of equivalent movements in property prices or development returns.
Romania led the annual comparison with a 39% increase, ahead of Hungary at 22% and Finland at 12.7%. France saw a 7.8% year-on-year contraction, Slovakia 4.9% and Spain 4.3%. Such differences highlight the limits of a single European average. They also call for country-level scrutiny of project pipelines, construction segments and underlying demand before drawing investment conclusions.
Why a Construction Recovery Is Not a Housing Supply Recovery
To assess future supply, investors need to separate four indicators: permits issued, construction starts, completed buildings and property transactions. The timing of these measures differs, particularly when developers face changing borrowing costs or uncertainty about sales. Higher activity by specialist contractors does not necessarily mean that more new homes are about to be handed over or that project profitability has improved.
International Investment has previously examined the European Union’s proposals to increase housing supply by easing development constraints. The latest activity figures explain why the success of those measures cannot be judged by the total construction index alone. Germany offers another useful comparison: growing investor interest in housing and a strong August construction reading still need to be tested against completions and delivery schedules.
The November Data Will Test the Recovery
Eurostat has scheduled the next construction production release for 19 November. The September reading will help establish whether August marked a lasting improvement or a short-lived bounce. Housing permits, completed units, construction costs and credit conditions will be necessary to evaluate what the activity recovery means for the property market. For now, the confirmed picture is one of improving total output alongside continuing weakness in building construction.
Frequently Asked Questions (FAQ)
How can EU construction grow while building output falls?
Specialised construction activities increased enough to lift the overall production index despite weaker building construction.
What does the 2% increase refer to?
It is the seasonally and calendar-adjusted monthly rise in EU construction production in August 2026 compared with July.
Does a 4.1% fall mean 4.1% fewer homes were built?
No. The figure is an annual decline in the output index for building construction, not a count of completed apartments.
Which countries recorded the largest annual increases?
Romania (+39%), Hungary (+22%) and Finland (+12.7%) led the total construction production figures for August.