







 Asunción Property Market Accelerates as Construction Booms
 Egypt Expands Aviation for Tourism Growth
 Latvia’s Residence Permits for Real Estate to Be Abolished from September 15
 Egypt Prepares New Law for Property Developers
 Young Japanese Buyers Turn to 50-Year Mortgages
 Argentina Narrows Tourism Gap as Arrivals Rise
London Housing Market Loses Buyer Confidence
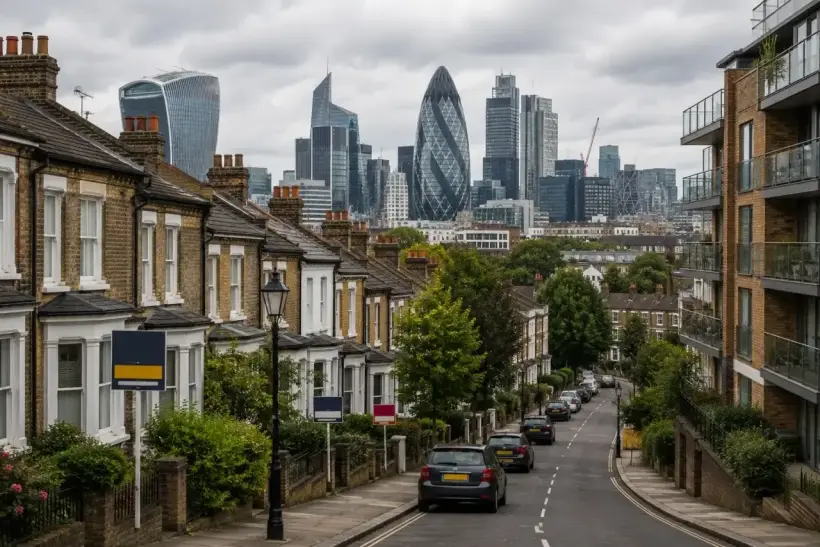
London’s housing market is entering the second half of 2026 with some of its weakest price expectations since 2023. Professional sentiment has deteriorated sharply, buyer demand remains subdued and actual prices in the capital have now fallen year on year for nine consecutive months. Yet Britain is not experiencing a nationwide housing crash: average UK prices remain above year-earlier levels, with weakness concentrated in London and other expensive southern markets. Mortgage costs are adding another layer of pressure, with average fixed rates turning higher again in August after easing earlier in the summer. Bloomberg highlighted the widening gap between London and other UK regions on Aug. 12.
London house-price expectations deteriorate sharply
The clearest warning comes from property professionals working directly with buyers and sellers.
The Royal Institution of Chartered Surveyors reported that the net balance for London house-price expectations over the next 12 months fell to -23% in July from -10% previously.
That compares with a positive UK-wide 12-month price expectations balance of +4%.
The methodology matters. A -23% balance does not mean London homes are forecast to lose 23% of their value. It measures the difference between the proportion of respondents expecting prices to rise and those expecting them to fall.
The national current-price balance stood at -30% in July, compared with -32% in June. New buyer enquiries remained at -28%, while agreed sales registered -30%. Three-month price expectations were still deeply negative at -31%.
There were some less bearish signals. Twelve-month sales expectations improved to +3%, the strongest reading since February, while new seller instructions recovered to -4% from -23% in June. The change suggests supply is stabilising rather than surging.
London house prices fall for a ninth consecutive month
Transaction-based statistics confirm London’s underperformance, although the actual decline is far smaller than the negative survey balances.
Average UK house prices stood at roughly £271,000 in May 2026, 2.7% higher than a year earlier.
London moved in the opposite direction. Prices were down 3.7% year on year after falling 2.3% in April, marking a ninth consecutive month of annual declines.
The divergence within the capital is particularly striking. Inner London prices fell 5.9% over the year, compared with a decline of just 0.3% in Outer London.
By comparison, the North East of England recorded annual growth of 5.9%, while Northern Ireland prices were 7.4% higher in the first quarter.
The rental market is moving differently. Average London private rent reached £2,302 a month in June, up 2.2% from a year earlier and still the highest regional level in England. Kensington and Chelsea had the country’s highest local average at about £3,596 a month.
The average London home falls to about £545,000
The average registered London residential property was valued at £544,814 in May, down from roughly £566,000 a year earlier.
Prices fell 1.2% in May alone.
Different property types, however, are moving at very different speeds. Flats and maisonettes fell 6.6% year on year to an average of about £423,000. Detached homes were down 2.3%, while terraced properties declined 0.6%.
Semi-detached homes actually increased by 0.4%.
The figures show that London’s weakness is concentrated not only geographically in Inner London but also within the apartment market.
Flats emerge as a weak point in London property
The 6.6% annual decline in flats is considerably larger than the 3.7% fall in the overall London index.
That matters because flats are an important entry point for first-time buyers and form a significant part of the capital’s investment market.
Buyers must account not only for mortgage repayments but also for service charges, building-related expenses and other recurring ownership costs.
When borrowing costs are high, those expenses reduce the amount purchasers can afford to pay for the property itself.
Investors face an additional calculation: rental income must compensate for mortgage costs, operating expenses, taxation and the risk of further capital-value declines.
London is unusually sensitive to mortgage costs
London’s exposure to higher borrowing costs is magnified by the size of the loans required to buy in the capital.
The same change in interest rates produces a much larger increase in monthly cash payments on a £600,000 or £800,000 property than on a home costing £200,000 or £300,000 elsewhere in Britain.
Transaction costs add another constraint. Zoopla estimated that a typical London first-time buyer can face stamp-duty costs equivalent to around 3% of the purchase price, compared with less than 1% for a comparable buyer in northern England.
Its June data also showed UK buyer demand down 15% year on year and agreed sales running 7% below the previous year. Three in five properties listed since the beginning of 2026 were still searching for a buyer by late June. More than two-thirds of one- and two-bedroom flats listed during the year remained unsold.
Bank of England holds its rate at 3.75%
The prospect of rapidly cheaper borrowing remains uncertain.
At the meeting ending July 29, the Bank of England kept Bank Rate unchanged at 3.75% by a 6–3 vote. Three members of the Monetary Policy Committee preferred a 0.25 percentage-point increase to 4%.
Consumer-price inflation stood at 2.6% in June, above the Bank’s 2% target.
Volatile global oil, gas and refined-energy prices have added another layer of uncertainty. Policymakers are concerned not only about the immediate impact on household energy costs but also about the possibility of higher prices feeding into company costs, wages and inflation expectations.
The central bank therefore has not committed itself to a predetermined path for rates.
Mortgage borrowing remains expensive
The effective rate actually paid on newly drawn mortgages rose to 4.35% in June from 4.22% in May.
Net approvals for house purchases recovered to 58,200 from 56,600 but remained below the previous six-month average of roughly 61,400.
Net mortgage borrowing increased to £7.7 billion from £3.3 billion in May.
The numbers therefore do not show a mortgage market that has stopped functioning. Credit continues to flow, but the pool of prospective buyers remains weaker than in recent periods.
Fixed mortgage rates turn higher again
This section requires an important correction from the previous version.
Average fixed mortgage rates fell during June. By the start of July, the typical two-year and five-year fixed rates had both declined to about 5.52%.
That improvement subsequently reversed.
By the start of August, the average two-year fixed mortgage had risen to roughly 5.63%, while the five-year average reached 5.66%. The broader average rate on new mortgage products rose by 0.12 percentage points to 5.59%.
The accurate picture is therefore not one of continuously rising rates through July, but of an early-summer decline followed by a reversal as inflation expectations and wholesale interest-rate conditions deteriorated.
Mortgage demand has yet to stage a convincing recovery
The increase in approvals from 56,600 to 58,200 might suggest improving activity, but the recovery remains limited.
Approvals are still below their recent six-month average, while survey measures of buyer enquiries remain firmly negative.
Different housing indicators also capture different stages of the transaction process. A mortgage approval signals potential future borrowing, an agreed sale records a deal between buyer and seller, and official price indices are based largely on transactions completed later.
As a result, those measures can point in different directions at the same time.
UK transactions remain stable but lag current conditions
An estimated 98,700 seasonally adjusted UK residential transactions worth at least £40,000 were completed in June.
That was less than 1% higher than in May and 2% above June 2025.
On a non-seasonally adjusted basis, transactions totalled about 103,050, rising 11% month on month and 6% year on year.
There is an important time lag. The tax authority notes that a completed transaction will typically occur around two to four months after the buyer initially makes an offer.
June completion data therefore largely reflect decisions taken during the spring and cannot yet fully capture the weaker sentiment reported in July.
London increasingly diverges from the rest of Britain
Regional divergence is one of the defining features of the current cycle.
UK house prices rose 2.7% over the year, while London fell 3.7%. Inner London declined by an even larger 5.9%.
That is materially different from a nationwide housing crash in which prices fall simultaneously across nearly every region.
More affordable parts of northern England and Northern Ireland remain much more resilient. London’s unusually high property values make the capital particularly sensitive to mortgage costs.
For investors, that also reduces the usefulness of a single national house-price index. Positive UK-wide growth provides little protection to the owner of a flat in a weakening Inner London market.
High rents provide only partial support to investors
Falling acquisition prices combined with rising rents might appear positive for rental yields.
The underlying economics are more complicated.
The July survey recorded a -27% balance for landlord instructions and a +28% balance for expectations of rental growth over the following three months, indicating that constrained rental supply continues to support rents.
Investors still have to absorb financing costs, service charges, insurance, taxation, vacant periods and the risk of further declines in property values.
Rising rents therefore do not automatically translate into stronger net investment returns.
Why the downturn has not become a crash
Despite London’s weakness, current indicators do not describe a systemic property collapse.
Transactions are continuing, mortgage lending remains available and some categories of London housing have experienced little or no annual decline.
Sellers also have the option of withdrawing properties instead of accepting large discounts.
That can reduce market liquidity and extend selling periods while simultaneously slowing the decline recorded by official price indices.
A housing correction can therefore take the form of several years of subdued transactions and stagnant nominal values rather than a sudden crash.
London housing outlook for the rest of 2026 deteriorates
The market is entering the second half of 2026 without an obvious catalyst for a rapid rebound.
A meaningful recovery would probably require cheaper mortgages, stronger household incomes or further price declines sufficient to restore affordability.
Current conditions point in the opposite direction: Bank Rate remains at 3.75%, three policymakers have already voted for an increase, average fixed mortgage rates have turned higher again and London’s 12-month price expectations balance has dropped to -23%.
A sharp collapse is not inevitable either. UK-wide prices remain higher than a year ago, completed transactions have been broadly stable and Outer London is performing far better than the central part of the capital.
The bigger risk may be a prolonged repricing.
Nominal property values could fall gradually or remain broadly stagnant for an extended period. In real, inflation-adjusted terms, that would still represent a more substantial decline in housing wealth.
According to International Investment experts, London’s core problem is the widening gap between property valuations established during the era of much cheaper financing and the purchasing power available under 2026 mortgage costs. A 3.7% annual fall in the overall index does not by itself indicate a crisis, but nine consecutive months of annual declines, a 6.6% fall in flats and a sharp deterioration in year-ahead expectations show that the correction has become persistent. For owners, the principal risk may not be a sudden crash but several years of weak capital appreciation combined with high holding costs. Buyers have gained negotiating power, but assuming that the first future rate cut will automatically trigger a rapid recovery in London property values would be premature.
FAQ: London Housing Market in 2026
Are surveyors forecasting a 23% fall in London house prices?
No. The -23% reading is a net balance of 12-month price expectations, not a forecast of a 23% decline in property values. It indicates that negative expectations substantially outweigh positive ones.
How much have London house prices actually fallen?
Average London values were down 3.7% year on year to May 2026. Inner London fell 5.9%, compared with only 0.3% in Outer London.
What is the average London house price?
The latest official transaction-based index puts the average at roughly £545,000, compared with about £566,000 a year earlier.
Which type of London property is falling fastest?
Flats and maisonettes have been particularly weak, with their average price down 6.6% year on year in May.
What is the Bank of England interest rate in August 2026?
Bank Rate is 3.75%. Six policymakers voted to hold it in July, while three preferred an increase to 4%.
How expensive are UK mortgages?
The effective rate on newly drawn mortgages was 4.35% in June. Average advertised fixed rates were higher: about 5.63% for a two-year fix and 5.66% for a five-year fix at the beginning of August.
Are UK housing transactions increasing?
Seasonally adjusted transactions rose by less than 1% in June from May and by 2% year on year. Completion data lag real-time market conditions because transactions generally complete several months after an offer is made.
Could London house prices fall further?
Yes. Expensive mortgages, weak buyer demand and negative expectations leave scope for further declines. The large difference between Inner and Outer London, however, suggests the adjustment is unlikely to be uniform across the capital.
When could the London housing market recover?
There is no reliable date. A sustained recovery would likely require improved mortgage affordability, stronger buyer demand or further adjustment in property prices.