







 Covivio Hotels Revenue Grows 4.7% as European Markets Split
 Lithuanian Apartment Prices Accelerate Across Major Cities
 Georgia's Tourism Revenue Hits Record High
 Norway's Sovereign Fund Commits €1.5bn to European Warehouses
 Market Rout of October 2026: Can Branded Hotels Protect Capital?
 Residential Property Prices in Tbilisi Rise by 5.9% Year-on-Year
Europe’s Aviation Growth Shifts to Low-Cost Carriers

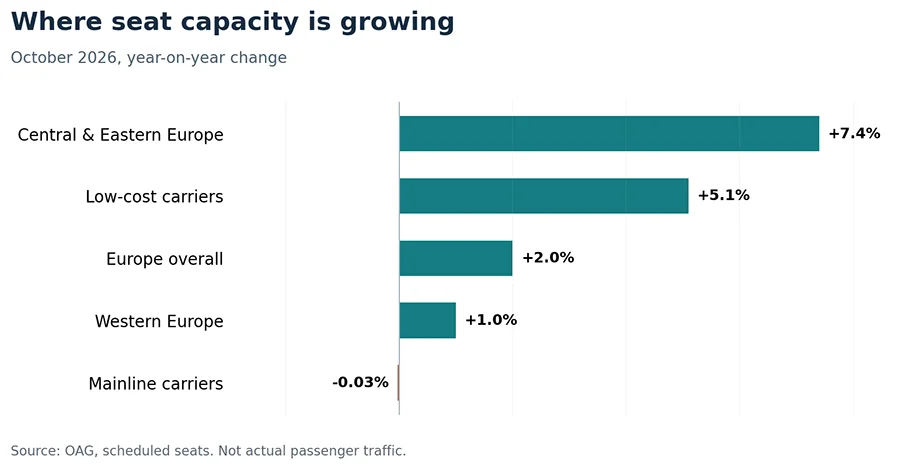
European airline capacity is growing slowly overall, but the map is changing. Airlines scheduled 160.7 million seats for October 2026, up 2% from a year earlier. Central and Eastern Europe increased capacity by 7.4%, low-cost carriers by 5.1%, and Wizz Air by 23.1%. Italy was the fastest-growing of Europe's ten largest national markets. For destinations and hotel investors, new connections may bring demand, but an additional scheduled seat is not yet an additional tourist.
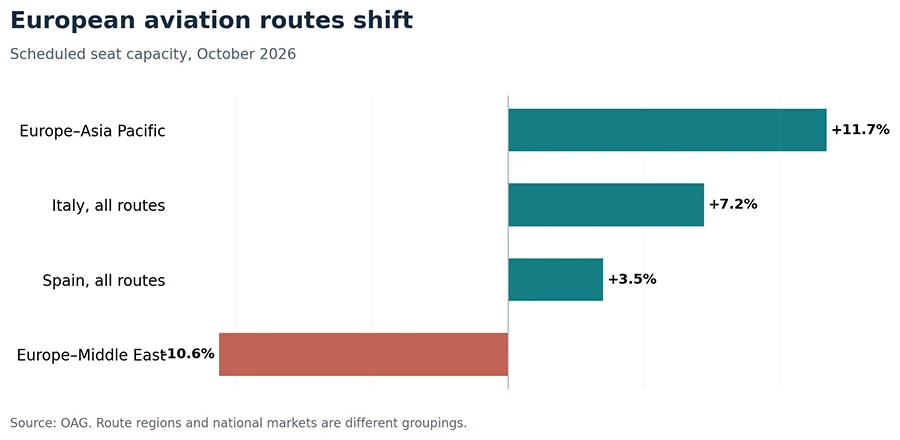
Carriers are expanding in selected markets while maintaining or cutting capacity elsewhere. Routes linking Europe and Asia Pacific are gaining seats; the Middle East corridor is contracting. These choices provide an early signal of where visitor flows may shift, rather than a forecast of hotel bookings.
Europe's capacity rises just 2%
OAG's October 2026 European aviation briefing records 160.7 million scheduled seats compared with 157.6 million in October 2025. International capacity rose 2.2% to 129.7 million and domestic capacity 0.9% to 31.1 million. This measures airline schedules, not passengers actually carried.
|
Market/segment |
Seats, million |
YoY change |
|
Europe overall |
160.7 |
+2.0% |
|
Central & Eastern Europe |
21.0 |
+7.4% |
|
Western Europe |
117.1 |
+1.0% |
|
Low-cost carriers |
64.9 |
+5.1% |
|
Mainline carriers |
95.8 |
−0.03% |
|
Wizz Air |
8.15 |
+23.1% |
|
Italy |
13.28 |
+7.2% |
Western Europe accounts for 117.1 million seats, approximately 73% of the regional total, but grew only 1%. Central and Eastern Europe expanded 7.4% to 21 million. Western Europe remains much larger, while the fastest proportional growth is shifting east.
Low-cost airlines outpace mainline carriers
Low-cost carriers scheduled 64.9 million seats for October, up 5.1%, and accounted for roughly 40% of the market. Mainline airlines offered 95.8 million seats and held the remaining 60%, virtually unchanged at −0.03% year on year. This is not a withdrawal by traditional airlines but a divergence in growth.
Low-cost operators can redeploy aircraft and adjust flight frequencies rapidly. New services may make city breaks and trips to see friends and relatives easier, although lower advertised fares are not guaranteed: route competition, fuel, aircraft utilisation and ancillary charges still determine what customers pay.
Wizz Air adds 1.53 million seats
Wizz Air became Europe's third-largest airline by scheduled October seats with 8.15 million, up from 6.62 million and a rise of 23.1%. Ryanair remained first with 20.19 million (+1.1%), followed by easyJet with 9.76 million (+0.9%). Lufthansa reduced capacity 6.7% and Vueling 9.8%. Even within the low-cost segment, growth varies sharply.
Wizz Air's expansion partly reflects aircraft being moved from Middle Eastern routes to Central and Eastern Europe, Spain, Italy, Croatia and Albania. Shorter sectors allow an aircraft to operate more flights a day, so growth in seat numbers need not match growth in available seat kilometres, which take route distance into account.
More passengers have not restored Wizz Air's profit
Wizz Air's results for April–June 2026 show the financial limits of rapid expansion. Passenger numbers increased 25.1% to 21.2 million and revenue grew just 5.5% to €1.51 billion. The group moved from a €38.4 million net profit a year earlier to a €198.2 million loss, despite a 90.9% load factor.
Higher fuel costs and lower revenue per unit of capacity squeezed earnings. Additional low-cost flights can benefit a tourism destination while imposing losses on the carrier. International Investment previously examined the reasons behind Wizz Air's quarterly loss and its European fleet redeployment.
Central and Eastern Europe gains connectivity
The 7.4% increase refers to OAG's Eastern/Central Europe grouping; it does not mean every airport or country expanded at that pace. For individual cities, the relevant measures include actual routes, foreign visitor arrivals, seasonality and the share of passengers continuing their journeys.
ACI EUROPE reports that passenger traffic through European airports increased 3.1% in August 2026. Slovakia grew 61%, Slovenia 19.3%, Estonia 16.4%, and Hungary 13%. These are actual airport passengers in August, not October scheduled seats, so the two datasets must not be treated as directly comparable observations.
Small airports can post very high percentage increases when a few routes open or return from a low base. That is a reason to investigate a market, not to assume hotel occupancy will rise at the same rate.
Italy leads major European aviation markets
Italy's October capacity reached 13.28 million seats, up 7.2%, the strongest growth among the top ten national markets. It added approximately 890,000 seats. Spain remained Europe's largest country market with 17.48 million (+3.5%), followed by the UK at 16.56 million (+1.2%).
Italian domestic capacity increased 8.9%, or about 331,000 seats, led by Aeroitalia and Wizz Air Malta as ITA Airways reduced parts of its domestic offer. Rome Fiumicino and Madrid were among the fastest-growing major European airports, each up 7% in scheduled capacity.
These developments can improve access to Italian cities and regions, but they do not establish that hotels in Rome or coastal resorts will gain a comparable number of guests. Domestic and connecting passengers have different accommodation needs.
Germany and France lose scheduled seats
France's October capacity was down 3%, Germany's 0.4%, Türkiye's 1.2% and Switzerland's 0.7%. German domestic services lost 9.1% of scheduled seats, illustrating the contrast with Italy. Changes can reflect airline economics, rail alternatives and hub strategy rather than a straightforward loss of tourism appeal.
Airport passengers also include people connecting to other flights and those returning home. Their hotel demand differs from that generated by visitors who spend several nights in a destination.
Europe–Asia gains seats as Middle East routes shrink
Scheduled seats between Europe and the Middle East declined 10.6% in October, roughly 1.1 million fewer than a year before. Capacity between Europe and Asia Pacific grew 11.7%, or 988,000 seats, to 9.4 million.
International flights within Europe remain the largest corridor, at 86.6 million seats (+2.2%), representing about 67% of international European capacity in OAG's sample. Asia-bound capacity growth is not the same as more Asian visitors to Europe: the seats can carry Europeans travelling outbound or transfer passengers who never enter the destination city.
Scheduled seats are a leading indicator, not tourist arrivals
Capacity is added to schedules before seats are sold and flights are operated. Only some arriving passengers become hotel guests; others live locally, connect onward or stay with friends and family. A rise in airline seats therefore cannot be converted directly into visitor arrivals or occupied hotel rooms.
Hotel investment analysis should combine planned and actual airline traffic, foreign arrivals, average length of stay, seasonal patterns, available hotel rooms, ADR and RevPAR. RevPAR reflects room revenue per available room and can weaken despite more visitors if hotel supply increases faster than guest nights.
International Investment's review of H1 2026 European hotels found 4.5% RevPAR growth, but wide differences across cities and continuing pressure from operating costs. New routes may help demand without necessarily lifting profits.
What new air routes mean for property investors
A direct flight can make an underserved city easier to reach and fill otherwise quiet hotel dates. The main risk is dependency on a single low-cost operator: airlines can relocate aircraft or cancel poorly performing routes quickly, while a hotel cannot move with its carrier.
Markets with several airlines, reliable surface connections, diversified visitor demand and a stable history of routes offer more protection. October's new schedules need to be checked against several seasons of actual airline and hotel performance.
What the October data imply for 2027
October capacity highlights where airlines are placing resources: Central and Eastern Europe, Italy and parts of the Asia-Pacific network. Yet it is a single month's schedule, not a forecast of 2027 tourist arrivals. The next test is how many flights operate, what occupancy they achieve, and whether additional passengers generate overnight stays.
For investors the most useful signal is the divergence beneath Europe's 2% headline growth. Connectivity is strengthening in some cities and weakening in others. Sustainable hotel returns will depend on turning that connectivity into repeatable guest demand and operating profit.
FAQ
How much did European airline capacity grow in October 2026?
OAG records 160.7 million scheduled seats, 2% above October 2025. This is not the number of passengers actually carried.
Why are low-cost carriers growing faster?
They are adding and redeploying more scheduled services. LCC seat capacity grew 5.1%, while mainline capacity was virtually flat.
How fast is Wizz Air expanding?
It scheduled 8.15 million October seats, a 23.1% increase and about 1.53 million more than a year earlier.
Where is airline capacity rising fastest in Europe?
Central and Eastern Europe grew 7.4% in OAG's regional classification. Italy led the ten largest country markets with 7.2%.
Why did Europe–Middle East capacity decline?
Airlines have adjusted networks amid geopolitical and operational risks. Scheduled capacity was down 10.6% year on year.
Do additional seats mean more tourists?
Not necessarily. Actual loads, international visitors, connections, length of stay and accommodation preferences must be considered.
What should hotel investors examine?
Route stability, airline competition, actual visitor nights, seasonality, hotel room supply, ADR, RevPAR and operating profits.