











China Housing Weakens Again as Recovery Stalls
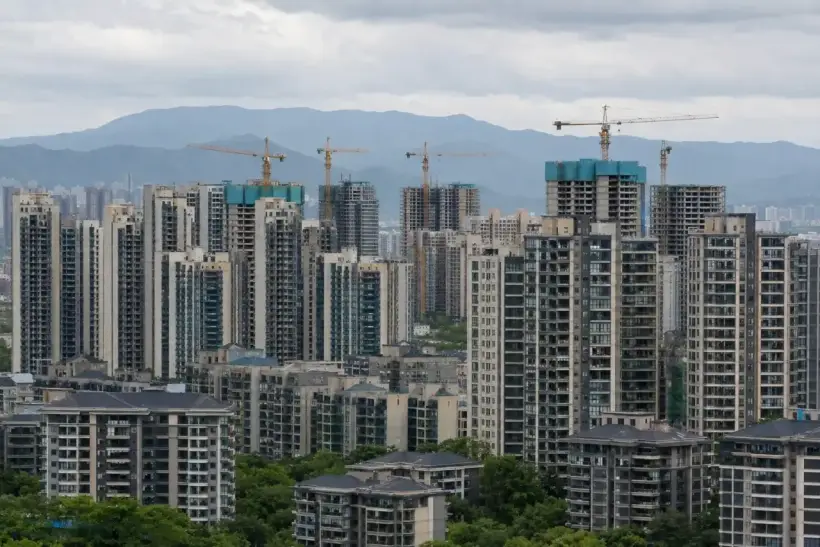
China’s housing market remained under heavy pressure in July 2026, with new-home prices falling month on month in 47 of the 70 major and medium-sized cities monitored by the government. Property development investment dropped 19.2% year on year in January through July, residential sales by floor area declined 12.7%, and residential construction starts fell 24.6%. Shanghai, Guangzhou and Shenzhen still recorded monthly new-home price gains, highlighting an increasingly sharp divide between China’s strongest metropolitan markets and smaller cities.
Bloomberg’s August 17 report highlighted renewed weakness in Chinese housing and the setback to expectations for a rapid recovery. One methodological distinction is important: the official release provides separate indices for 70 cities rather than one government-published national average for the group. News organizations therefore construct their own aggregate measures, producing slightly different estimates from the same underlying city data.
New-Home Prices Fall Across Most Chinese Cities
China’s National Bureau of Statistics reported that new commercial residential prices across the four tier-one cities were unchanged from June after rising 0.1% the previous month. Tier-two prices fell 0.1%, while tier-three prices declined 0.3%.
The four tier-one markets are Beijing, Shanghai, Guangzhou and Shenzhen. Beijing was the only one to record a monthly new-home price decline, falling 0.3%. Shanghai gained 0.2%, Guangzhou 0.1% and Shenzhen 0.2%.
Prices increased or remained unchanged in 23 of the 70 monitored cities, compared with 21 in June. That means 47 markets recorded declines, down from 49 a month earlier. The geographical spread of stabilization therefore improved slightly even though falling prices continued to dominate the sample.
Whether the Decline Accelerated Depends on Methodology
The conclusion that China’s average monthly price decline accelerated is sensitive to the method used to aggregate the city-level data.
Dow Jones calculated that prices across the 70 cities fell 0.18% in July after declining 0.15% in June. Under that calculation, the monthly downturn did accelerate. The year-on-year decline, however, narrowed to 3.41% from 3.5%.
Reuters produced a different aggregate result, calculating a 0.1% monthly decline in both July and June. Its year-on-year measure improved to a 3.2% drop from 3.3%.
The most defensible conclusion is therefore that China’s housing market remains weak rather than that every measure shows a faster price decline. Official tier data indicate renewed monthly weakness in tier-two cities and continued declines in tier-three markets, while the four largest cities were flat on average.
Annual Price Declines Are Gradually Narrowing
New-home prices in tier-one cities were 1.1% below year-earlier levels in July, with the decline narrowing by 0.2 percentage point from June.
Shanghai remained the clear exception. Its new-home prices were 3% higher than a year earlier. Beijing fell 2.3%, Guangzhou declined 2.2% and Shenzhen was down 2.9%.
Tier-two prices declined 2.8% year on year, with the contraction narrowing by 0.3 percentage point. Tier-three prices remained 4.2% below the year-earlier level, with the rate of decline unchanged.
The official figures therefore do not support the conclusion that annual price deterioration is accelerating everywhere. Monthly weakness remains broad, but annual declines are narrowing in the two strongest city groups.
China’s Resale Market Remains Weaker
Existing-home prices continue to show deeper declines than the primary market.
Tier-one resale prices rose an average 0.2% from June after increasing 0.3% the previous month. Beijing was unchanged, Shanghai rose 0.3%, Guangzhou gained 0.4% and Shenzhen increased 0.2%.
Tier-two resale prices fell 0.3% during July and tier-three prices declined 0.4%. Only eight of the 70 cities recorded rising or unchanged resale prices, two fewer than in June. Existing-home values therefore fell in 62 cities.
Annual declines remained severe. Tier-one resale prices were down 3.7%, tier-two prices 5.1%, and tier-three values 5.8%. Beijing fell 4.5%, Shanghai 2%, Guangzhou 4.7% and Shenzhen 3.6%.
Property Investment Has Fallen 19.2%
Developer activity deteriorated far more sharply than headline prices. Property development investment totaled RMB 4.301 trillion in January through July, down 19.2% from a year earlier. Residential investment fell 19.1% to RMB 3.317 trillion.
During the first half, total property investment had fallen 18% and residential investment 17.8%. The addition of July therefore widened the cumulative contractions by 1.2 and 1.3 percentage points respectively.
Investment fell 19.7% in eastern China, 20% in the central region, 15.9% in western China and 29.7% in the northeast, showing that the contraction remains geographically broad.
Residential Construction Starts Have Dropped 24.6%
Developers had about 5.576 billion square meters of property under construction during January through July, 12.7% less than a year earlier. Residential construction area declined 13% to 3.871 billion square meters.
New starts fell considerably faster. Construction began on 267 million square meters of property, down 24%, while residential starts declined 24.6% to 194.9 million square meters.
During the first half, total starts were down 23.4% and residential starts 24.1%, meaning July pushed both cumulative declines deeper.
Completions also remained weak. Total completed floor area fell 23.2% to 191.95 million square meters, while residential completions declined 25.5% to 134.43 million square meters.
Residential Sales Fell 12.7%
The 450.21 million square meters reported for January through July refers to all newly built commercial buildings sold, not residential property alone. That total was down 11.8% year on year.
Residential property accounted for 374.25 million square meters, down 12.7%. The value of residential sales fell 13.2% to RMB 3.754 trillion.
Across all newly built commercial property categories, sales value totaled RMB 4.272 trillion, down 13.1%.
Compared with the first half, sales volumes deteriorated slightly while sales values improved modestly. Total floor area had been down 11.6% in January through June and residential area 12.4%; the seven-month declines widened to 11.8% and 12.7%. Total sales value improved from a 13.6% contraction to 13.1%, while residential sales value improved from a 13.7% fall to 13.2%.
Completed Unsold Inventory Remains Large
At the end of July, developers held 759.11 million square meters of completed commercial property available for sale or lease but not yet sold or rented, 0.8% less than a year earlier.
Residential property accounted for 405.56 million square meters, effectively unchanged year on year. Properties that had remained in the available-for-sale category for less than three years totaled 555.59 million square meters, down 3.6%.
Total available inventory stood at 763.15 million square meters at the end of June, implying a decline of about 4.04 million square meters during July.
The decline should not automatically be read as evidence of strong demand because construction starts and completions are falling sharply at the same time. Part of the inventory adjustment is occurring through a reduced flow of new supply. This is an inference from the official data.
Developer Funding Is Down 20.3%
Funds received by property developers totaled RMB 4.575 trillion during the first seven months, down 20.3% year on year.
Domestic loans fell 32.1% to RMB 630 billion. Self-raised funds declined 18.5% to RMB 1.654 trillion, while deposits and advance payments from buyers dropped 14.4% to RMB 1.438 trillion.
Personal mortgage proceeds received by developers fell 23.5% to about RMB 604 billion. Weak property sales therefore continue to constrain an important source of cash available for future development.
China’s Broader Economy Is Also Losing Momentum
Housing weakness is coinciding with softer domestic economic indicators.
Industrial production at large enterprises increased 4.5% year on year in July, slowing from 5.3% in June. Seasonally adjusted monthly growth was only 0.11%.
Retail sales totaled RMB 3.902 trillion and increased just 0.6% year on year. Growth for January through July was 1.2%. Vehicle sales fell 17% in July, furniture sales declined 8.8%, and building and decoration material sales dropped 14.2%.
Fixed-asset investment excluding rural households fell 6.7% in January through July to RMB 26.033 trillion. Private investment declined 9.4%, while fixed investment excluding property development fell 3.7%. On a seasonally adjusted basis, total fixed-asset investment contracted another 1.42% from June.
The surveyed urban unemployment rate increased to 5.2% in July from 5.0% in June. Employment and income expectations matter for housing because they affect households’ willingness and ability to make large leveraged purchases.
GDP Growth Slowed in the Second Quarter
China’s economy expanded 4.3% year on year in the second quarter of 2026. Growth for the first half was 4.7%.
Construction-sector output contracted 4.1% year on year in the second quarter, while real-estate-sector value added fell 0.2%. These indicators reinforce the evidence from investment, sales and construction that the prolonged property adjustment continues to affect related areas of the economy.
Beijing Continues to Ease Local Restrictions
Policy support remains targeted rather than uniform nationwide. Beijing further relaxed home-purchase restrictions in early August and expanded access to mortgages through the housing provident fund system.
The sharper performance gap between major metropolitan areas and smaller cities suggests that local economic strength and housing supply conditions are increasingly important determinants of the recovery. That inference is supported by the official tier-level price data.
China’s New-Home Sales Outlook Has Deteriorated
Fitch Ratings cut its 2026 forecast in June and now expects Chinese new-home sales to fall 11%-13% for the full year, compared with its previous projection of a 7%-8% decline. It cited weak demand, elevated housing inventories and a recovery concentrated in stronger cities.
The agency also said continued policy easing and lower contagion risks from developer defaults should provide some support, but characterized the recovery as fragile rather than self-sustaining.
China’s Housing Market Is Becoming Increasingly Two-Speed
Shanghai new-home prices are 3% higher than a year ago, while tier-three markets are down an average 4.2%. In the resale market, Shanghai has declined 2%, compared with an average 5.8% fall in tier-three cities.
At the same time, nationwide developer indicators remain far weaker than the headline price figures in the strongest cities: property investment is down 19.2%, construction starts 24%, residential sales floor area 12.7%, and developer funding 20.3%.
Monthly price gains in Shanghai, Guangzhou and Shenzhen are therefore not yet sufficient evidence of a nationwide housing recovery.
As International Investment experts report, the biggest risk in interpreting July’s data is treating narrower annual price declines in the strongest cities as proof that China’s multi-year property correction has ended. Price conditions are genuinely improving in some metropolitan areas, but the sector’s fundamental indicators remain considerably weaker: investment is contracting by almost one-fifth, residential construction starts by nearly one-quarter and developer funding by more than 20%. A durable turn would require not only stable prices but also a sustained recovery in sales and financing alongside a reduction in completed unsold housing. For now, the figures point more clearly to a prolonged and increasingly uneven restructuring than to a broad property rebound.
FAQ: China Property Market in 2026
Are Chinese home prices still falling?
Yes. New-home prices declined month on month in 47 of the 70 monitored cities in July. Tier-one prices were flat on average, tier-two prices fell 0.1%, and tier-three prices declined 0.3%.
Did China’s home-price decline accelerate in July?
It depends on the aggregation method. One calculation shows the monthly fall widening from 0.15% to 0.18%, while another produces a 0.1% decline in both June and July. Both show a modest narrowing of the annual decline.
Which major Chinese cities are seeing higher new-home prices?
Shanghai, Guangzhou and Shenzhen recorded monthly increases in July. Shanghai was the only one of the four tier-one cities with annual new-home price growth, at 3%.
What is happening to China’s resale market?
Existing-home prices fell in 62 of the 70 cities during July. Year-on-year declines were 3.7% in tier-one cities, 5.1% in tier-two markets and 5.8% in tier-three cities.
How much has property investment fallen?
Property development investment declined 19.2% year on year in January through July to RMB 4.301 trillion. Residential investment fell 19.1%.
How much have new-home sales fallen?
Residential floor area sold declined 12.7% to 374.25 million square meters. Residential sales value fell 13.2% to RMB 3.754 trillion.
Why is the 450.21 million square meter figure not the same as home sales?
Because it covers all newly built commercial buildings sold, including categories other than residential property. Residential sales accounted for 374.25 million square meters.
What is happening to construction?
Total new construction starts fell 24%, while residential starts dropped 24.6%. Residential completions declined 25.5%.
How much completed property remains available?
Completed commercial property available for sale or lease totaled 759.11 million square meters at the end of July, including 405.56 million square meters of residential property.
Has China’s housing downturn ended?
There is clearer stabilization in several major cities, but nationwide sales, investment, construction and developer funding remain substantially below year-earlier levels. The data do not yet establish a broad recovery.