
read also
 China to Accelerate Fiscal Spending After Growth Slows
 Saudi Arabia’s Economy Contracts by 4.8%
 Mortgage-Free Home Purchases in Russia Rise by 26.5%
 Poland Joins Europe’s Travel Core
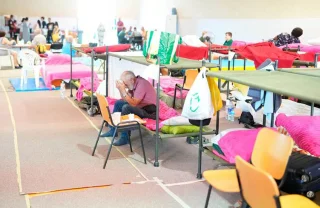 Wildfires in Spain: the largest evacuation in the 21st century
 Austria Leads Albania Investment as Property Takes 43%
Analytics / Research / Ratings / Reviews / Iceland / Poland / Norway / Denmark / Finland / Germany / Armenia / Portugal / United Kingdom / Georgia / Russia / USA / Canada / Sweden / Belarus 15.12.2025
Ranking of national leadership: where governments are closest to their populations
The Global Leadership Project platform has published a ranking showing which population groups are represented in the governments of different countries. The study analyses the composition of national leaders across four parameters — gender, ethnicity, religion, and language — and compares it with the population structure. The ranking covers 156 countries and makes it possible to see how closely national leadership reflects the social makeup of society and where the most visible gaps persist.
Top 10: maximum alignment
The top 10 includes countries where the composition of national leadership most closely matches the population structure in terms of gender, ethnicity, religion, and language. Iceland takes first place: the country shows the smallest gap between the population and its leaders, while the indices for ethnicity (0.96) and language (0.93) are among the highest in the world.
Second place goes to Poland, which also demonstrates outstanding results in ethnicity and language. It is followed by Norway, Denmark, and Finland. Despite minor differences in their final indices, all of them share consistently high alignment across several parameters, including gender representation.
Germany ranks sixth, combining strong results in ethnicity (0.94) and language (0.90) with a lower gender index (0.82). Seventh place is held by Armenia, with a very high ethnic score (0.95) and stable values for religion and language. Portugal comes next, showing a balanced profile across the main indicators. The top ten is rounded out by Tunisia and Madagascar, both displaying high values for ethnicity and religion and a relatively small gap between population structure and leadership composition.

From Sweden to South Korea
Sweden ranks 11th (0.83), where high gender indicators are combined with strong social metrics. Qatar is in 12th place, showing very high alignment in ethnicity and religion but lagging significantly in female representation. It is followed by Malta, Croatia, Jordan, and Greece. China stands out with almost perfect ethnic and language results, but one of the lowest gender scores in this group pulls down its overall position.
In Serbia, religious and cultural profiles are the strongest, while the share of women in power remains low. France and Thailand are marked by strong socio-cultural indicators, whereas in Egypt the religious index becomes one of the key components. In Italy and South Korea, high ethnic scores contrast with a pronounced gender gap.

Between Britain and Belarus
The United Kingdom and Japan take 35th and 36th places, respectively, with strong cultural and language profiles, though their final scores are reduced by low female participation. Russia ranks 47th, trailing in women’s representation and the religious parameter.

Turkey, in 54th place, shows high alignment in religious and social indicators, but the gender gap remains the main constraint. Azerbaijan, ranked 59th, displays a similar pattern of strengths and weaknesses. Georgia (0.75) also occupies 59th place, combining strong results in ethnicity and religion; the gender component is lower than others but does not determine the final outcome.
Below them are Cyprus, Spain, Switzerland, and Montenegro. Albania ranks 90th, Ukraine 98th. The United States is in 106th place with a final score of 0.69. Here, relatively strong language and partly ethnic indicators are combined with lower alignment in religion and gender. As a result, the composition of the national elite remains noticeably narrower than the actual social structure of the population.
Belarus holds 107th place in the ranking. The country’s ethnic indicator is fairly high (0.79), reflecting relative population homogeneity and its alignment with those in power. However, the share of women in national leadership is low. Religious and language indicators remain at a medium level.

Weakest results
At the bottom of the ranking are countries with the most pronounced discrepancies between national leadership composition and population structure. In these states, nearly all key indices perform poorly at the same time.
Canada ranks 146th. With an overall score of 0.61, the ethnic component is particularly weak: an index of 0.39 indicates that leadership is significantly less diverse than the population. At the same time, Canada’s gender score is relatively high, but it does not compensate for the overall representation gap.
Indonesia is among the lowest-ranked countries: weak cultural and religious indicators significantly reduce its overall result. Below it are the Solomon Islands, where the power structure only partially reflects the demographic picture. The Central African Republic also shows major discrepancies across several parameters, including women’s participation.
Sierra Leone has one of the deepest gaps in the ranking, with extremely low social and gender indicators. Last place goes to Congo, which recorded minimal values for ethnicity, religion, and gender, resulting in the lowest overall index among all 156 countries.

What the ranking shows
According to the GLP methodology, no country achieves full alignment between leadership composition and the population: all states have a negative representation gap. Researchers highlight several trends.
The gender component most often proves to be the weakest, as women’s representation remains low in many countries. Large political bodies tend to reflect populations more accurately than small elites. In countries with multiple ethnic, religious, or linguistic groups, the gap is usually wider: the more diverse a society is, the harder it is to ensure the presence of all communities within a limited number of leadership positions.
The authors stress that the ranking is not intended to assess the level of democracy, but rather to compare countries, analyse institutional reforms, and study the data and reasons behind the persistent gap between populations and those in power.
Read more:
Countries with the Richest Cultural Heritage: Perception Ranking
Top 25 World Economies 2025: Who Shapes Global Growth
TOP-10 Richest Countries in the World
The Most Popular Countries to Move to in 2025: 1st Move International Ranking
Where Is the Best Place to Retire: Global Citizen Solutions Report