
read also
 Fed Split Revives Threat of Higher Rates
 Reviews Expose Argentina’s Tourism Weaknesses
 Bank Indonesia Expands Support for Rupiah
 Central Banks Return to Gold After Weak Start
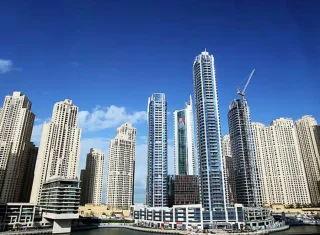 Dubai Real Estate Market Slows Amid Middle East Conflict
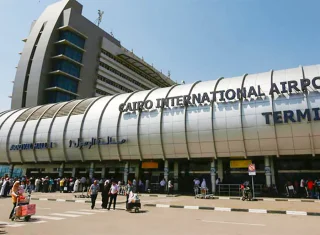 Egypt launches digital visa-on-arrival system at Cairo International Airport
Airbnb market in Tokyo: foreign traffic, strict regulations and seasonal fluctuations
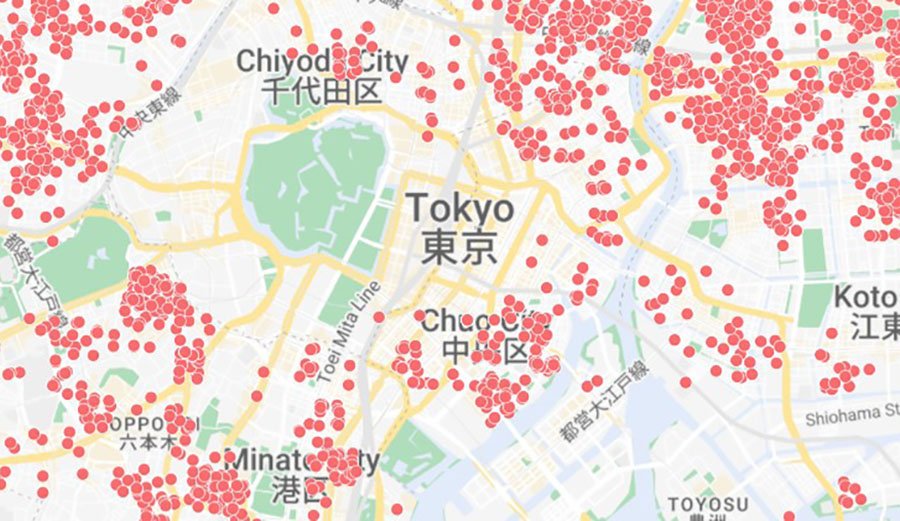
The short-term rental market in Tokyo remains tightly regulated, and operating without a license is almost impossible. Hosts rely on strict cancellation rules, while demand is shaped almost entirely by foreign travelers, according to the AirROI analysis for January–December 2025.
General indicators
Tokyo has 16,619 active Airbnb listings. The average daily rate reaches 193 dollars, occupancy holds at 60.1%, and the median annual revenue stands at 36,798. The market shows positive dynamics: revenue increased by 9.4% compared to 2024. The gap between segments is significant: the top 10% of listings earn from $7,558 per month, the median level is around $2,829, and the bottom 25% generate roughly $1,538.
A small segment of top listings stands out, earning disproportionately more. Some properties generate from $350,000 to $600,000 per year due to occupancy above 70% and premium nightly rates often exceeding $1,300–2,100. Concentration also plays a major role: the largest hosts manage 50 to 120 units each and collect annual revenue in the range of $3–6.5 million with stable quality scores around 4.6–4.8.
Seasonal performance
April delivers the highest income — an average of $4,533 with 74% occupancy and a $196 ADR. The lowest point is August, when revenue drops to $3,147 and occupancy falls to 51%, although nightly rates remain high at around $194.
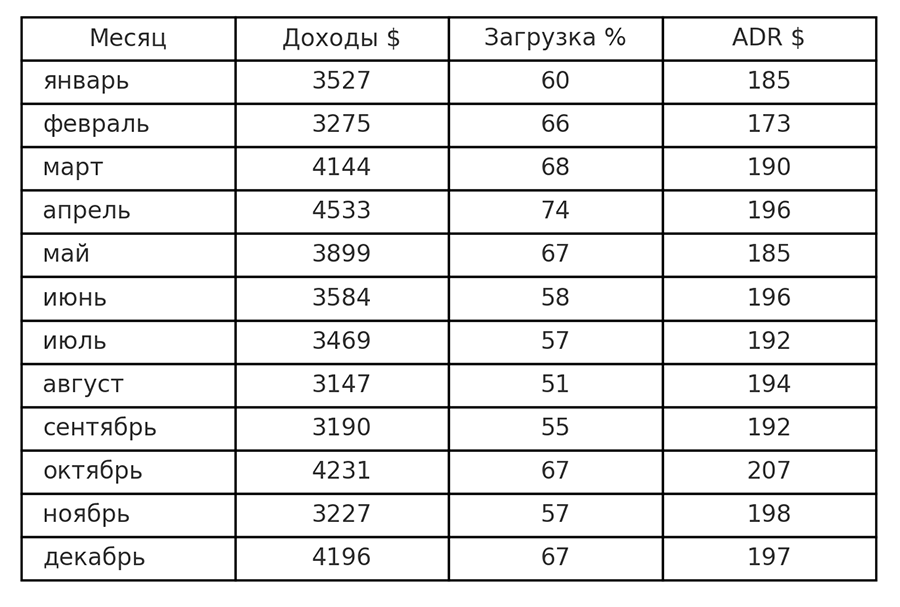
Several stable patterns become clear between the seasonal extremes. First, revenue peaks are observed not only in spring but also in autumn: in March ($4,144), October ($4,231) and December ($4,196) revenue is noticeably above average with occupancy at 67–68%. This creates three demand “waves” during the year: early spring, October and the pre-holiday period. Second, summer is weaker due to occupancy, not pricing. In June and July, occupancy drops to 57–58%, and in August to 51%, while ADR stays at $192–194. Hosts rarely offer discounts, and lower revenue comes from fewer bookings.
In February, one of the highest occupancy levels (66%) is paired with the lowest ADR at $173. This is the only month when the market stimulates demand with lower pricing. The opposite situation occurs in October: with good occupancy of 67%, ADR reaches the annual maximum of $207.
One-bedroom listings lead the market
Compact rental formats dominate Tokyo. Almost 60% of listings are one-bedroom units, another 15% are two-bedroom units, and together they make up roughly three-quarters of the market. Apartments and condominiums account for about 72% of supply, while houses hold around 19%. Due to strict regulations, the long-stay segment is expanding quickly: 36.9% of listings have a minimum stay of 30 nights or more, placing Tokyo among the world’s largest long-stay hubs.
Cancellation policies are also strict. Almost half of all listings offer limited refund options, and about 23% use the strictest conditions. As a result, more than 70% of the market operates with non-flexible cancellation rules. Guests usually plan well in advance: the average lead time is 51 days, rising to 68 days in November — the annual peak.
Who comes to Tokyo
According to AirROI, the overwhelming majority of guests in Tokyo are foreign travelers — their share reaches 96%. The largest flow comes from the USA, Australia, Canada, France and the UK, and the most frequent origin cities are New York, Los Angeles, London, Paris and Seoul. This shapes the overall audience profile: travelers arrive with high expectations for service quality, digital convenience and accommodation standards.
Gen Z and Alpha play a particularly strong role. They account for about half of all guests and actively influence the market. For these generations, stable fast internet, modern appliances, contactless check-in, clear rules and convenient urban infrastructure are essential. This group relies less on traditional hotel models and prefers flexible, tech-driven accommodation formats.
Popular districts
Shibuya remains one of the most sought-after districts among tourists who want a vibrant rhythm, nightlife and bold urban energy. It is the choice for those seeking to stay close to iconic sites such as the famous crossing and trendy retail clusters. Shinjuku serves two audiences at once — business travelers and tourists. It concentrates office quarters, transport nodes, skyscrapers, restaurants and bar streets, making it a convenient base for both work trips and short breaks.
Harajuku traditionally attracts young visitors and fashion enthusiasts. Takeshita Street and the surrounding area create a distinct cultural and visual identity, and guests value the experience of being immersed in this atmosphere. Akihabara caters to fans of electronics, gaming and anime. It is not just a retail hub but a district with a unique identity that sustains steady demand among niche traveler groups.
Asakusa maintains its status as the leading “traditional” area — visitors choose it for its temple complex, historic streets, craft shops and the atmosphere of old Tokyo. Ginza and Roppongi are favored by affluent guests, lovers of fine dining, art and comfortable urban environments. Roppongi also remains one of the main centers for expats. Ueno is popular among families, offering parks, museums, a zoo and convenient transport access.
Gross and net yields
Analysts from Global Property Guide and U-Occino estimate the average gross yield in Tokyo at 3.59%. After taxes, maintenance and operational costs, the figure typically drops by a couple of percentage points. Accordingly, net yields average 1.59%. With potential vacancies, the return may fall even lower and turn negative.
Nationwide, gross yields average 4.47%, and net yields stand at 2.47%. Higher levels are recorded in Sapporo — 4.98% (2.98%) — and Yokohama — 4.70% (2.70%). In most locations, yields range between 4.26–4.48%, meaning net returns remain slightly above two percent.
Analysts at International Investment note that Tokyo is one of the most heavily regulated markets. Investors should consider high entry barriers, modest profitability, strict rules and other local specifics. Operating in Japan in general is a complex project for foreigners. At the same time, long-stay formats and luxury properties show stable growth, reflecting global market trends.