







 "Bike&Wine": Italian Journalists Tour Georgia by Bicycle
 Tanker Hits Cruise Ship in the US
 Thousands of US Flights Canceled After Major Technical Outage
 Best Cities in Europe for Real Estate Investment
 This Year Has Been a Record-Breaker for Tbilisi Hotels — Shalva Alaverdashvili
 Friends, Shopping, and Leisure: Why and at What Age Do Georgian Residents Travel Abroad Most Often?
Georgia Construction Costs Spike in September: What Drove the Price Increase?
Non-residential construction costs rose by 10.2% year-on-year, with civil engineering making the largest contribution to the overall index increase. In September, rising wages became the main driver of surging construction costs, while on an annual basis, transport, fuel, and electricity expenses exerted the strongest pressure.
In September 2026, construction cost inflation in Georgia accelerated. According to Sakstat, the Construction Cost Index increased by 2.3% compared to the previous month and by 6.0% compared to the same period of the previous year. The September figure is particularly noteworthy given that monthly index movements throughout the year were repeatedly negative or only moderately positive.
Data indicates that cost pressures across the construction sector are distributed unevenly. The price growth in residential construction is relatively modest, whereas significantly higher growth is recorded in non-residential and civil engineering. Crucially, total costs are driven not only by building material prices, but also by labour costs and expenses on transport, fuel, and electricity.
Construction cost growth accelerated in September
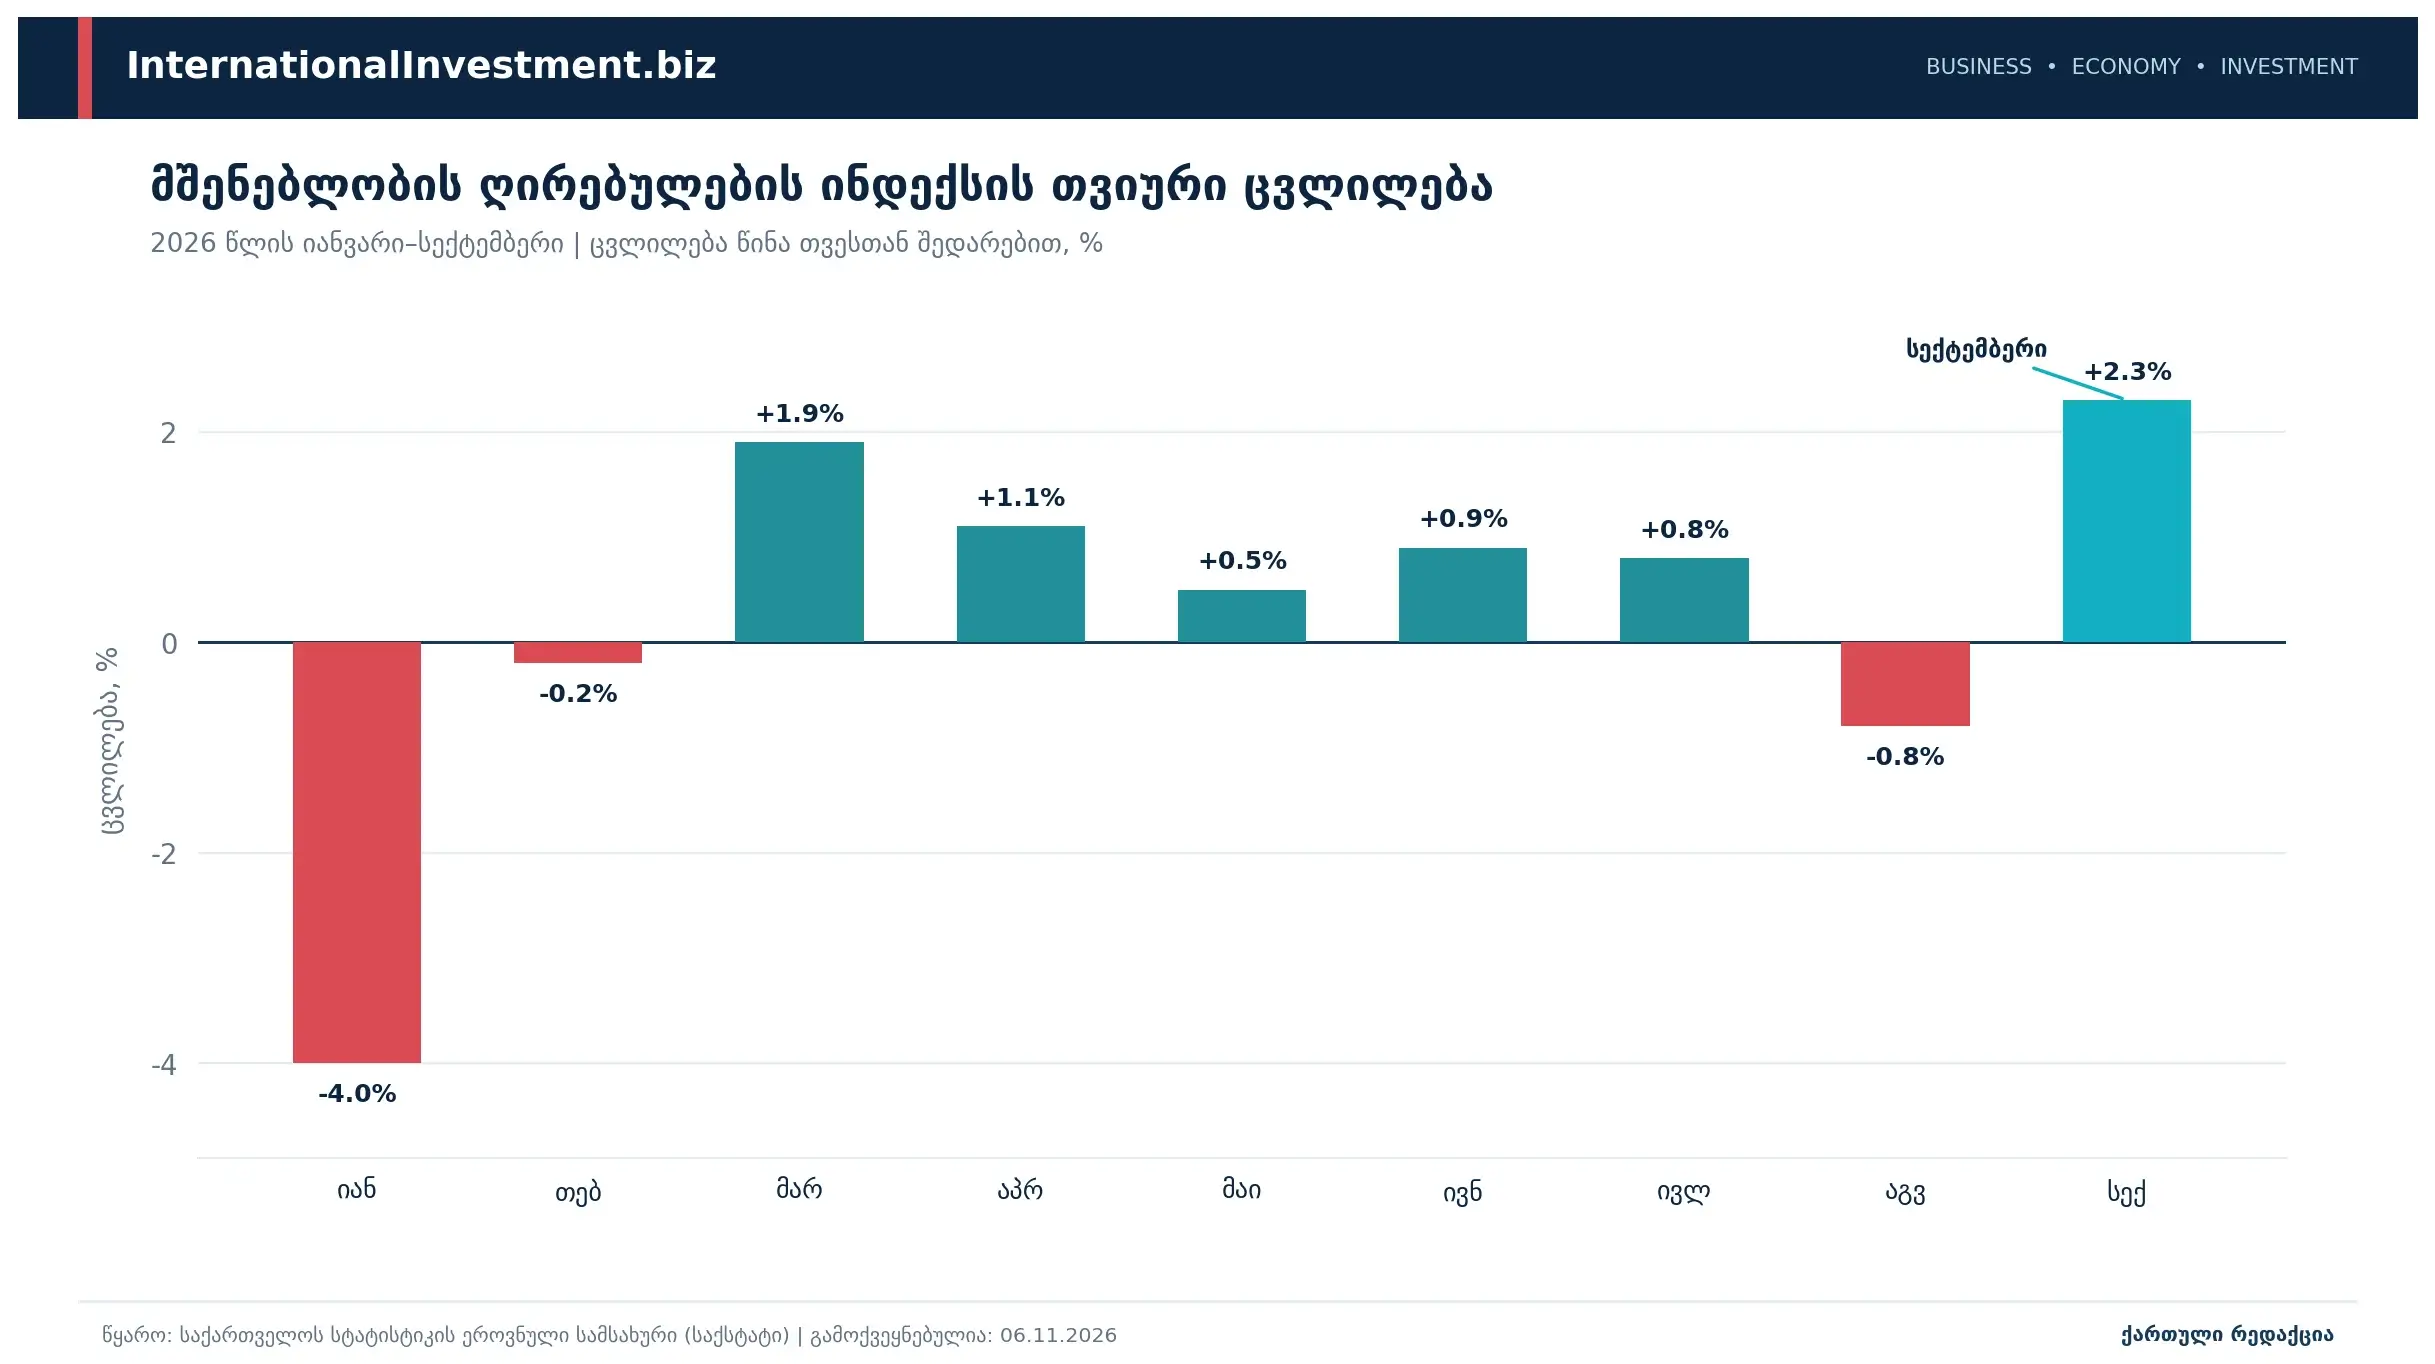
In September 2026, the Construction Cost Index rose by 2.3% compared to August. According to more detailed Sakstat data, the change was 2.33%.
The September figure is particularly telling when looking at monthly trends throughout the year. In January 2026, the index fell by 4.0% compared to the previous month, in February it dropped by 0.2%, in March an increase of 1.9% was recorded, in April — 1.1%, in May — 0.5%, in June — 0.9%, and in July — 0.8%. In the subsequent two months, the index declined again by 0.8% in August, before jumping by 2.3% in September.
Thus, the September increase was not merely a rebound after the August decline, but also the highest positive monthly change across the first nine months of 2026.
This dynamic indicates that construction costs fluctuated unevenly throughout the year, and in September, the pressure from escalating expenses intensified.
Wages — the main driver of the September price hike
According to Sakstat explanations, the increase in the Construction Cost Index in September was mainly driven by growth in the average monthly nominal wage of hired workers in the construction sector.
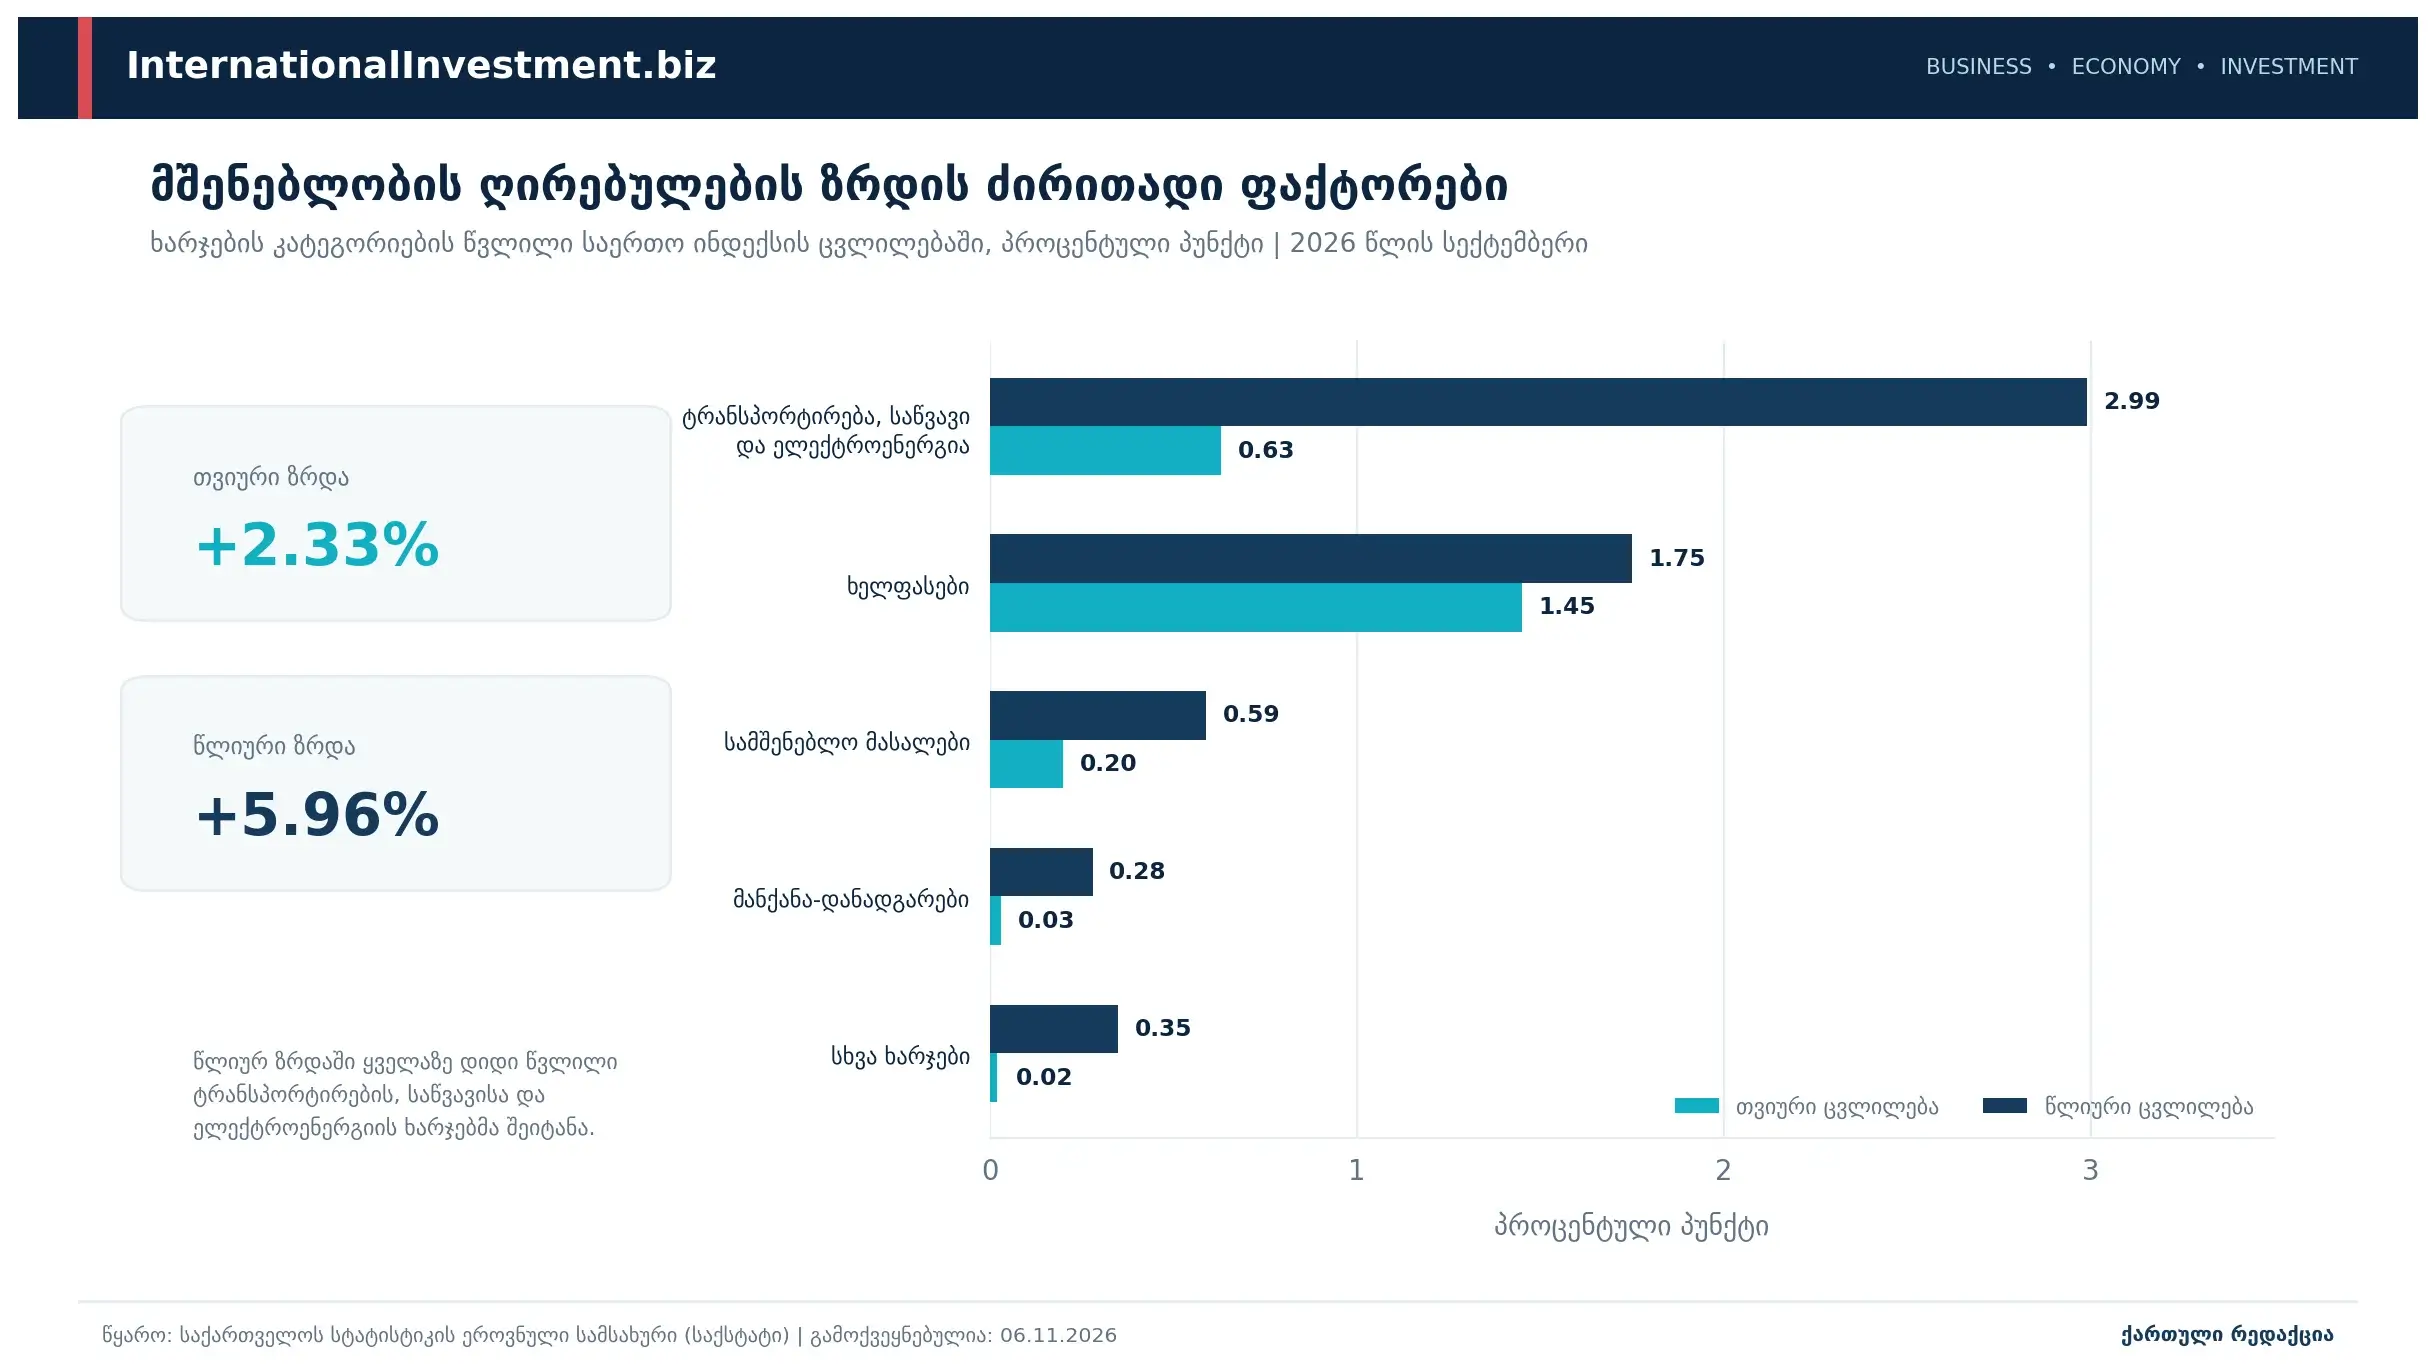
During the reporting period, average nominal wages in the construction sector grew by 7.3% compared to the previous month. This factor contributed 1.45 percentage points to the change in the total Construction Cost Index.
This means that approximately 62% of the overall September growth of 2.33% was due specifically to wage changes.
The contribution of other cost components was relatively small. In particular, the transport, fuel, and electricity category contributed 0.63 percentage points to the monthly increase, construction materials — 0.20 percentage points, machinery and equipment — 0.03 percentage points, and other costs — 0.02 percentage points.
Consequently, labour costs became the leading factor in the structure of September's price hike. This circumstance is especially important for construction companies, whose project budgets are directly impacted by human resource costs.
Main source of annual cost increase — transport, fuel, and electricity
Year-on-year data paints a different picture. Compared to September 2025, the current Construction Cost Index grew by 6.0%, yet the largest share of this growth stemmed from transport, fuel, and electricity costs.
The index for this category rose by 25.9% year-on-year, contributing 2.99 percentage points to the overall index increase.
Labour compensation was the second most significant component. The average monthly nominal wage of construction workers grew by 5.4% year-on-year, contributing 1.75 percentage points to the total index increase.
As a result, price changes in transport, fuel, electricity, and wages accounted for about 79.5% of the annual index increase.
The impact of remaining expenditure categories was relatively modest: the construction materials index grew by 1.0% year-on-year, machinery and equipment by 5.0%, and other costs by 5.6%.
The 1.0% annual increase in construction material prices deserves special attention. It demonstrates that the rise in sector-wide aggregate expenditures cannot be explained merely by raw material price inflation. Operational and labour costs accompanying the building process are exerting substantial pressure.
Non-residential construction costs rising fastest
According to the Construction Cost Index, significant variations exist across sectors.
Specifically, in September 2026 compared to the same period of the previous year, residential construction costs increased by 0.7%, non-residential construction costs jumped by 10.2%, and civil engineering costs rose by 9.4%.
Thus, in the non-residential construction segment, annual price inflation significantly outpaces the residential sector.
A similar gap is observed on a monthly basis. Specifically, in September, the residential index rose by 0.8%, non-residential by 5.9%, and civil engineering by 2.3%.
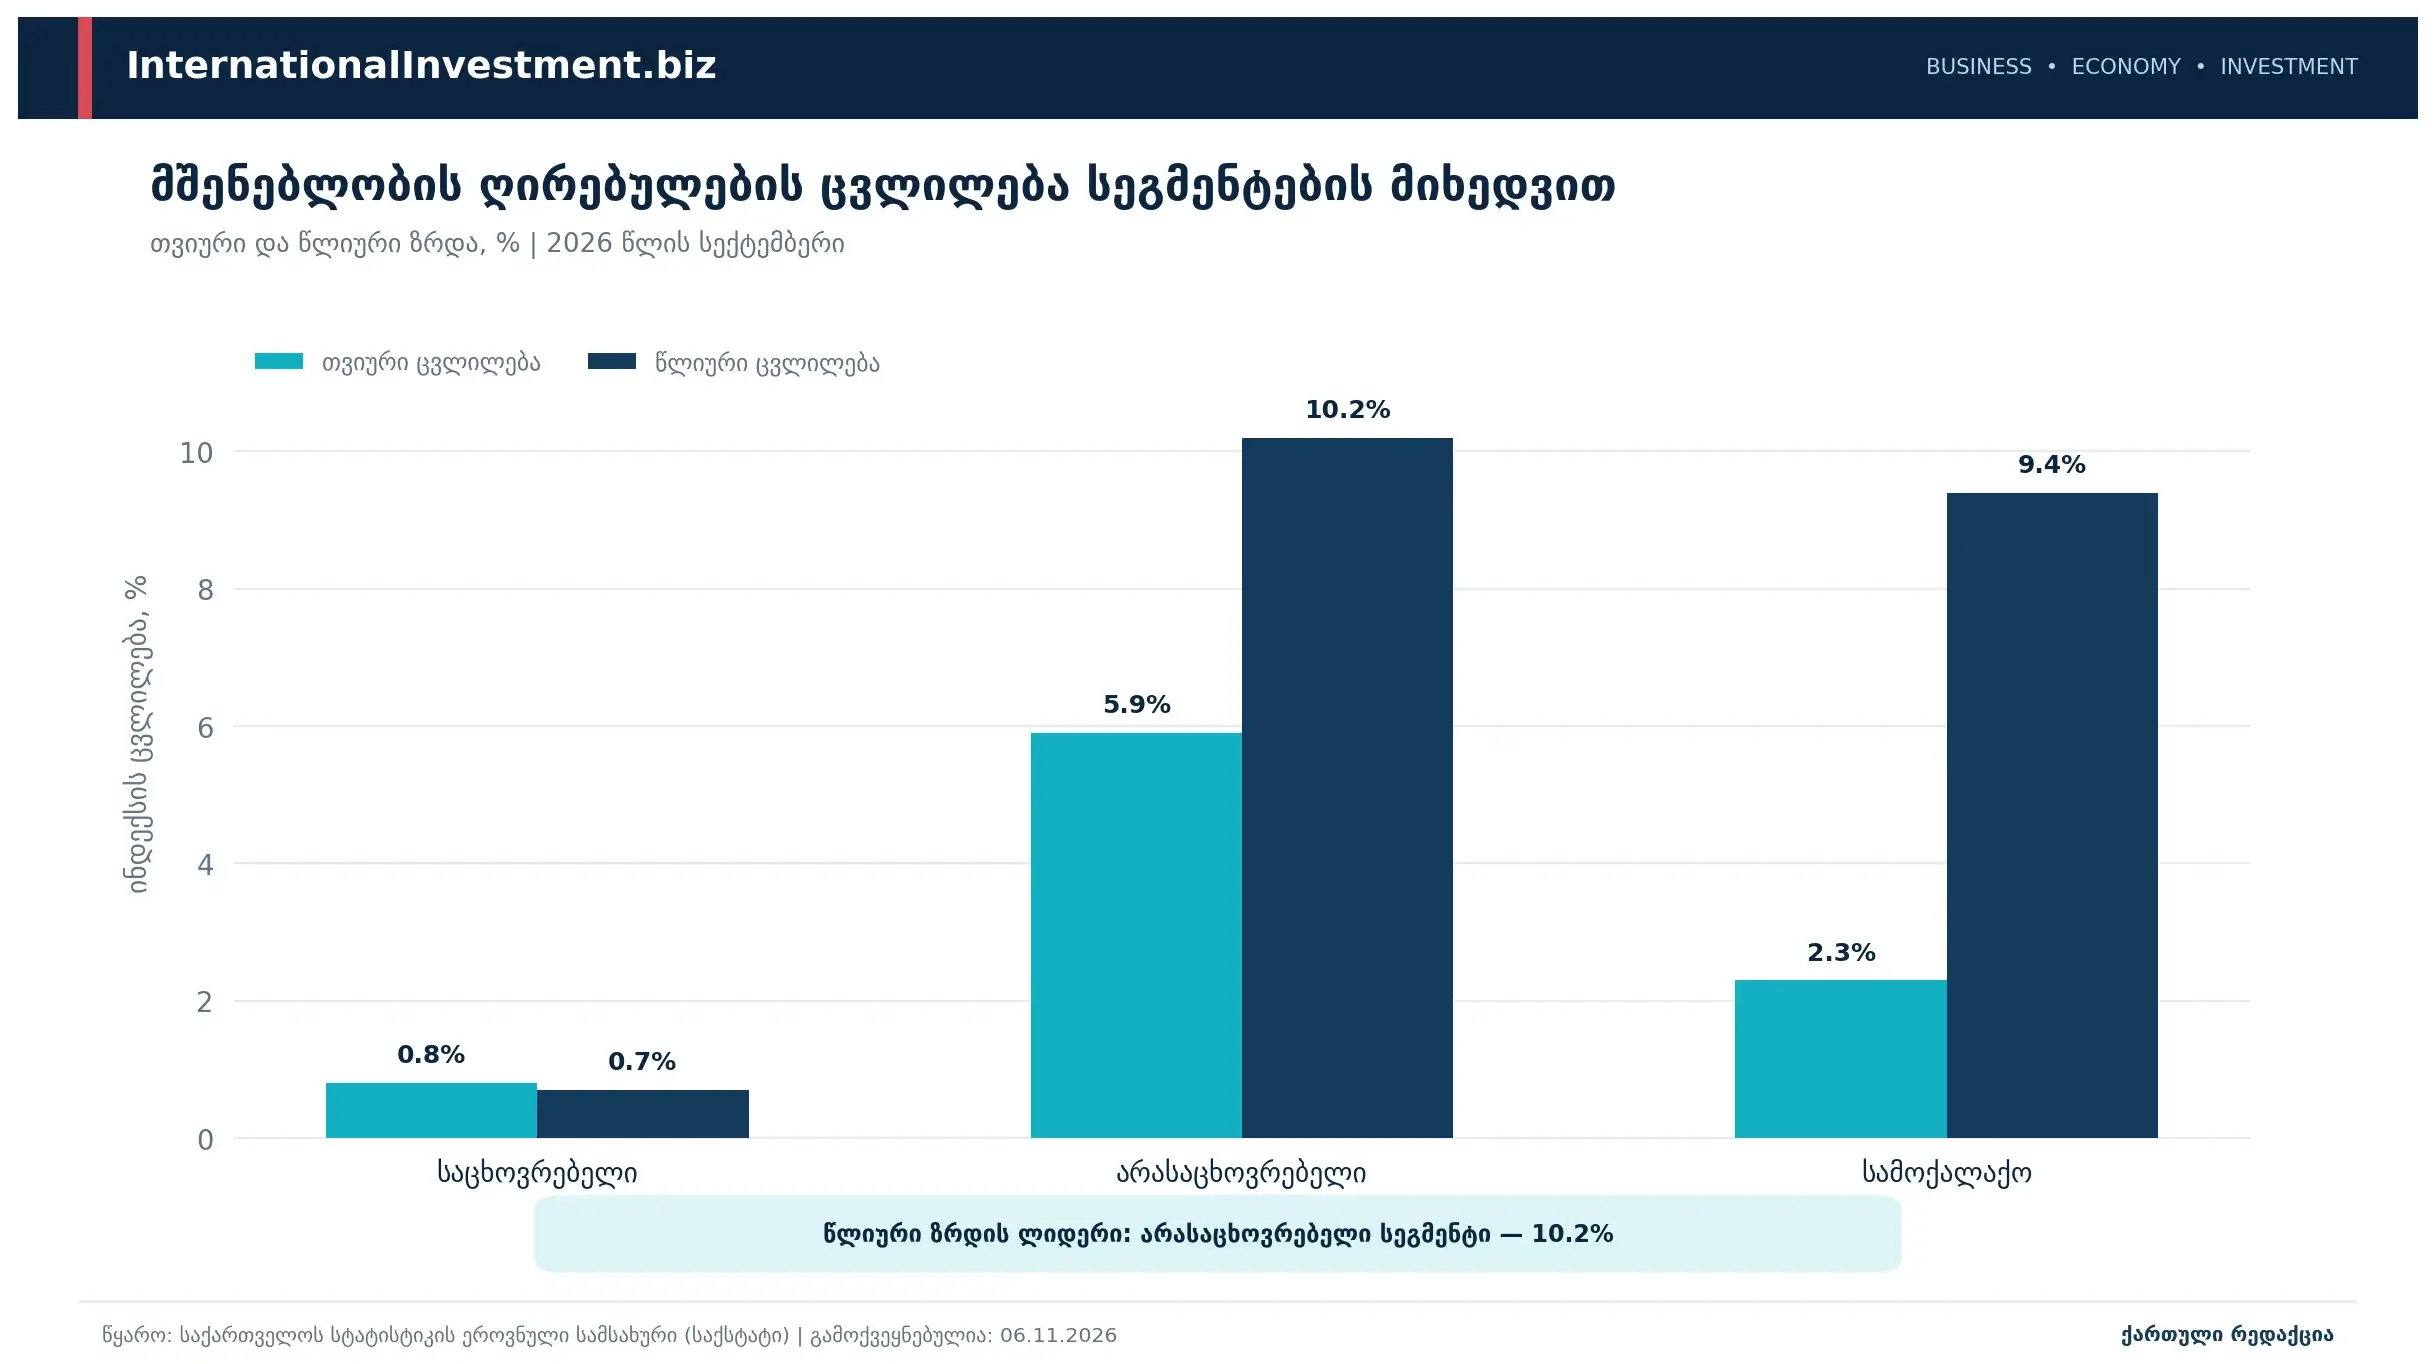
These figures highlight that construction cost growth is uneven across sectors, with especially strong expenditure pressure felt in non-residential construction.
However, the civil engineering segment made the largest contribution to the overall index. Out of the 5.96 percentage points of annual growth, 3.98 percentage points came from civil engineering. According to the same data, the non-residential segment contributed 1.61 percentage points, and residential — 0.36.
This distinction is critical, as a segment's rate of cost growth and its contribution to the overall index are not identical: the overall figure is also shaped by each segment's relative weight. Accordingly, while non-residential construction recorded higher price growth, civil engineering contributed significantly more to the overall index increase.
Construction expenses up 32.2% compared to February 2022
Beyond short-term trends, tracking long-term shifts in construction expenditures is equally vital.
According to Sakstat data, in September 2026, the Construction Cost Index was up 32.2% compared to February 2022.
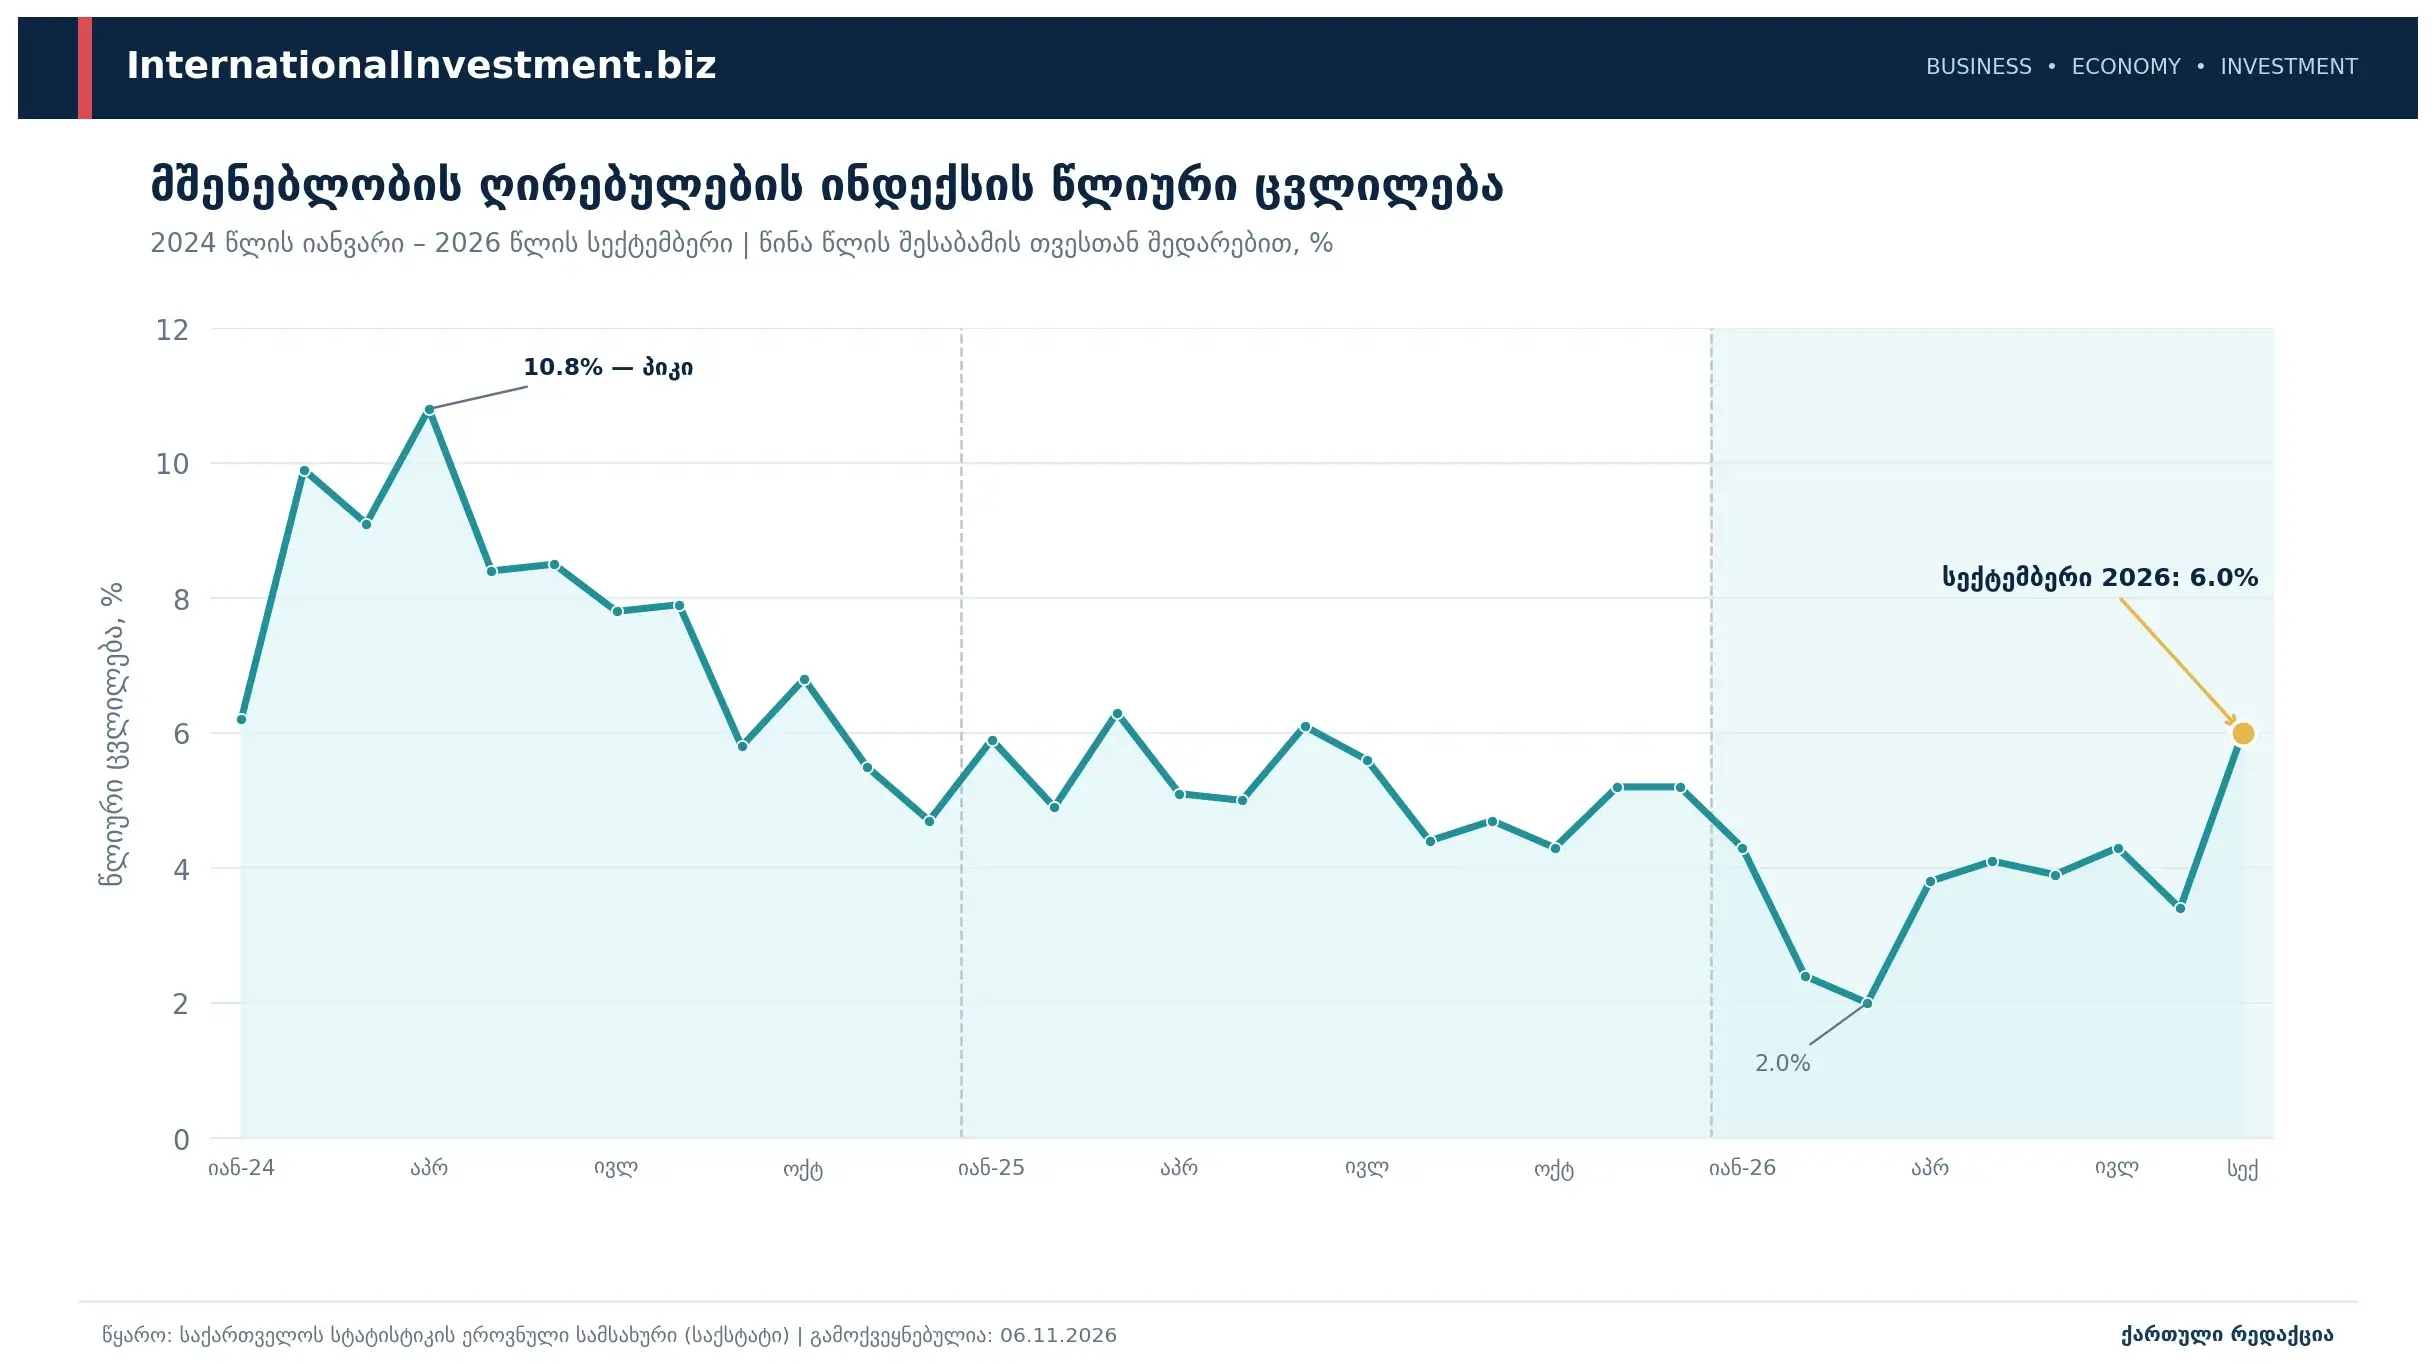
This figure confirms that the construction industry is operating amid substantial cumulative cost increases. Although annual growth rates remained relatively subdued in early 2026, the figure climbed back up to 6.0% in September.
This trajectory is clearly illustrated by annual trends. In March 2026, the index growth slowed to 2.0%, reached 3.8% in April, 4.1% in May, 3.9% in June, 4.3% in July, dipped to 3.4% in August, and then spiked to 6.0% in September.
Accordingly, the September data points to a renewed acceleration in construction cost growth.
What does this mean for the construction and investment sectors?
The dynamics of the Construction Cost Index are important for developers, investors, and businesses delivering infrastructure projects alike.
First and foremost, the impact of wage increases highlights that project cost estimation must pay close attention to labour costs. The significant contribution of wages in September confirms that this component can substantially alter overall project budgets.
The second factor is transport, fuel, and electricity. The annual 25.9% price increase in this category and its 2.99 percentage point contribution to the total index demonstrate that operational expenses in the construction process remain a primary cost challenge.
The third aspect is sectoral divergence. Applying a blanket cost estimate across residential, non-residential, and civil construction will not provide an accurate picture: each project type has a specific cost structure and its own rate of price growth.
For investors, this data is crucial for project financial modelling, capex forecasting, and evaluating potential pricing risks. September results show that budgets based on past expenditure benchmarks may require revision.
At the same time, an increase in the Construction Cost Index does not automatically translate into residential real estate sales price increases at the same rate. The index reflects changes in construction costs and does not measure land values, market prices of real estate, the supply-demand balance, or developer margins. Assessing these aspects requires additional market data.
Conclusion: the sector's main challenge lies in cost structure
Statistics for September 2026 demonstrate that rising construction costs in Georgia remain an ongoing challenge. However, the structure of cost inflation is more critical than the top-line percentage figure alone.
On a monthly basis, the primary driver was a 7.3% surge in wages. In year-on-year terms, the greatest impact came from a 25.9% increase in transport, fuel, and electricity expenses. Meanwhile, non-residential construction is seeing the fastest cost inflation, while civil engineering contributes the most to the overall index growth.
For the construction sector, this indicates that economic feasibility evaluations for upcoming projects must place special focus on labour costs, energy expenditures, transport logistics, and the specific cost breakdown within individual segments.
Source: National Statistics Office of Georgia (Sakstat) — “Construction Cost Index in Georgia, September 2026”, published on 6 November 2026.
InternationalInvestment.biz - Georgian Editorial Team