







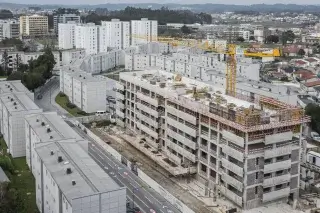





Canadian Home Prices Stabilize as Listings Fall

Canada’s housing market delivered its clearest recent sign of stabilization in July 2026 as the national benchmark home-price index rose 0.1% from June, its first monthly increase since November 2024. Sales advanced for a fourth consecutive month while the flow of newly listed properties declined again. The figures do not yet amount to a broad recovery: benchmark values remain 3.3% below year-earlier levels, actual transactions are down 5.3% from July 2025, and conditions differ significantly between Toronto, Vancouver, Calgary and Montreal. The latest shift was highlighted in an Aug. 18 Bloomberg report.
Canadian home prices rise for first time since November 2024
The Canadian Real Estate Association said seasonally adjusted residential transactions increased 0.5% from June in July, extending the sequence of monthly gains to four. Actual sales that were not adjusted for normal seasonal patterns remained 5.3% below July 2025.
The national composite MLS Home Price Index, which is designed to track changes in comparable properties rather than changes in the mix of homes sold, rose 0.1% month over month. It was the first increase since November 2024. The index remained 3.3% lower on a year-over-year basis.
The actual national average sale price was C$674,819, up 0.2% from a year earlier. The difference between the rising average price and falling benchmark is significant: average values can change when a larger share of transactions takes place in expensive cities or property categories, while the benchmark attempts to measure the value of more comparable homes.
July therefore provides evidence that the sustained monthly decline has stalled, but a 0.1% increase is too small to establish a new nationwide appreciation cycle while annual benchmark values remain negative.
New listings decline as the market moves toward balance
New listings fell 1.6% from June, marking a third consecutive monthly decline. With sales edging higher at the same time, the national sales-to-new-listings ratio increased to 51.3%, compared with a long-term average of 54.7%.
A ratio of roughly 45% to 65% is generally consistent with balanced conditions. Lower readings tend to give buyers greater leverage, while sustained higher readings indicate tighter supply and stronger conditions for sellers.
There were 205,388 residential properties listed for sale nationwide at the end of July. That was only 0.6% more than a year earlier and approximately 1.5% above the long-term seasonal average. National resale inventory is therefore no longer expanding rapidly.
Months of inventory declined to 4.7, the lowest level recorded so far in 2026 and slightly below the long-term average of five months. Levels below about 3.6 months are generally associated with a seller’s market, while readings above 6.4 months point toward substantially softer conditions favouring buyers.
The change in supply may prove more important than the small increase in the national price index. If fewer properties come onto the market while transactions remain stable or continue to improve, sellers face less pressure to cut prices.
Toronto stabilizes but remains well below earlier activity
Regional conditions remain sharply divided. RBC Economics found that Toronto-area resales increased for a fifth consecutive month in July, the longest sequence of gains in about three years. Benchmark values also increased for a second consecutive month.
The year-over-year comparison remains weak. Toronto’s benchmark price was 4.6% below July 2025, while resale activity remained more than 30% below pre-pandemic levels. Condominiums continue to face particularly heavy pressure, with their benchmark price down 7.4% from a year earlier.
New listings have declined for three consecutive months, helping to slow the accumulation of inventory. That may support broader price stabilization, but the large supply of condominium apartments continues to increase competition among sellers.
Toronto has therefore moved from rapid deterioration toward gradual normalization rather than entering a strong recovery.
Vancouver remains under pressure
Vancouver weakened again in July. Seasonally adjusted resales fell by more than 8% from June, reversing some of the improvement seen in the spring. The local benchmark price declined 6.2% year over year, compared with a 6% drop the previous month.
Affordability remains a major obstacle. Even after the prolonged correction, prices have not fallen sufficiently to generate a sustained return of pent-up demand, while elevated inventory continues to provide buyers with considerable choice.
Calgary faces a different supply pattern. New listings declined in five of the previous six months and active inventory was more than 4% lower than a year earlier. The overall benchmark fell 2.1% year over year, while condominium prices were down 8.4% and condo transactions dropped roughly 20%.
Montreal has been more resilient. Seasonally adjusted transactions were estimated to have increased by more than 3% from June, although condominium inventory was roughly 20% higher than a year earlier, limiting further price momentum.
The divergence illustrates why the national 0.1% increase cannot be treated as a proxy for every Canadian market. The country’s largest metropolitan areas remain at very different stages of the housing cycle.
Bank of Canada keeps policy rate at 2.25%
The Bank of Canada held its overnight policy rate at 2.25% on July 15. The Bank Rate remained at 2.5% and the deposit rate at 2.20%. Policymakers described housing activity as weak but showing signs of stabilization.
Canada’s broader economic backdrop remains subdued. Real gross domestic product is projected to grow by only 0.7% in 2026, followed by 1.8% in both 2027 and 2028. The unemployment rate was 6.5% in June and has mostly remained in a 6.5%-7% range since the end of 2024.
Lower borrowing costs can support housing demand, but mortgage rates alone are unlikely to trigger a rapid recovery. Employment, household income, down-payment requirements, credit qualification and affordability remain important constraints.
The next scheduled policy-rate decision is due on Sept. 2, 2026.
Inflation rises while shelter costs slow
Statistics Canada reported that annual consumer-price inflation accelerated to 3% in July from 2.8% in June. Higher gasoline prices and travel-tour costs contributed to the acceleration, while the shelter component increased a more moderate 1.3% year over year.
The combination of elevated headline inflation and weak housing activity complicates the interest-rate outlook. Softer housing conditions favour relatively accommodative financial conditions, but a renewed acceleration in consumer prices reduces the case for aggressive monetary easing.
For prospective buyers, that means a recovery cannot depend exclusively on expectations of sharply cheaper mortgages. Improvements in affordability will also have to come through income growth, price adjustment and changes in housing supply.
Residential building permits rise 6.3%
The value of residential building permits increased 6.3% from May in June to C$8.11 billion. Multi-unit residential permits rose 5.6% to C$5.31 billion, while permits for single-family homes increased 7.5% to C$2.80 billion.
Permitted projects represented 26,106 housing units, an 8.4% monthly increase. Multi-unit projects accounted for 21,924 units, up 8.6%, while single-family homes accounted for 4,182 units, an increase of 7.4%.
Building permits represent authorized construction intentions rather than completed housing. There can be a substantial delay between approval, construction start and delivery, particularly for large apartment and condominium projects.
That distinction matters because several major Canadian markets currently have substantial completed or resale condominium inventory even as weaker project launches could eventually reduce future supply.
Canada’s 2026 housing outlook remains subdued
Canada Mortgage and Housing Corporation expects weak demand, lower average prices and declining construction in 2026. Its baseline forecast projects about 457,200 resale transactions, down from 470,314 in 2025, while the national average resale price is expected to decline from C$679,543 to C$675,200.
Housing starts are forecast to fall from 259,028 units in 2025 to 241,400 in 2026, then to 223,400 in 2027 and 211,900 in 2028. Resale activity, by contrast, is expected to recover gradually to 472,900 transactions in 2027 and 485,500 in 2028.
The national average resale price in that scenario rises to C$698,900 in 2027 and C$717,300 in 2028. The forecast is based on information available as of June 23, meaning it does not incorporate the latest July market data.
A separate industry forecast released July 15 is somewhat more optimistic. It projects 463,336 residential transactions in 2026, a 1.4% annual decline, but expects the national average price to rise 1.1% to C$686,710. For 2027, it forecasts 480,567 sales and an average price of C$694,164, also up 1.1%.
The two outlooks therefore disagree on whether Canada’s average home price will rise or fall in 2026. Both, however, point to modest changes rather than a return to rapid nationwide appreciation.
July’s figures are best interpreted as evidence that the housing correction is losing momentum. Sales have increased for four consecutive months, new listings are declining, inventory has moved closer to historical norms and the benchmark price has finally posted a monthly increase. Yet benchmark values remain below year-earlier levels, transaction volumes are still weak and some of Canada’s most expensive housing markets remain under pressure.
As International Investment experts report, the more important July development is not the symbolic 0.1% rise in the national benchmark but the slowdown in inventory accumulation. If fewer sellers enter the market while transactions remain stable or improve, downward price pressure may continue to ease. Investors should nevertheless avoid treating the national figure as evidence of a new Canadian housing boom. Toronto, Vancouver, Calgary and Montreal differ significantly in inventory, liquidity and price direction, making local market conditions more important than the national average when assessing investment property in 2026.