







 Georgian Law Enforcement Busts Scammers Posing as Real Estate Brokers
 Turkish Airlines Cancel Flights to Moscow
 Escalation in the Middle East: New US and Iranian Strikes
 Hong Kong Property Rebounds as Momentum Slows
 Bulgaria’s Property Market Enters a More Mature Phase
 UK House Prices Rise as Mortgage Demand Weakens
World’s Largest Economies in 2026: GDP and Purchasing Power Rankings
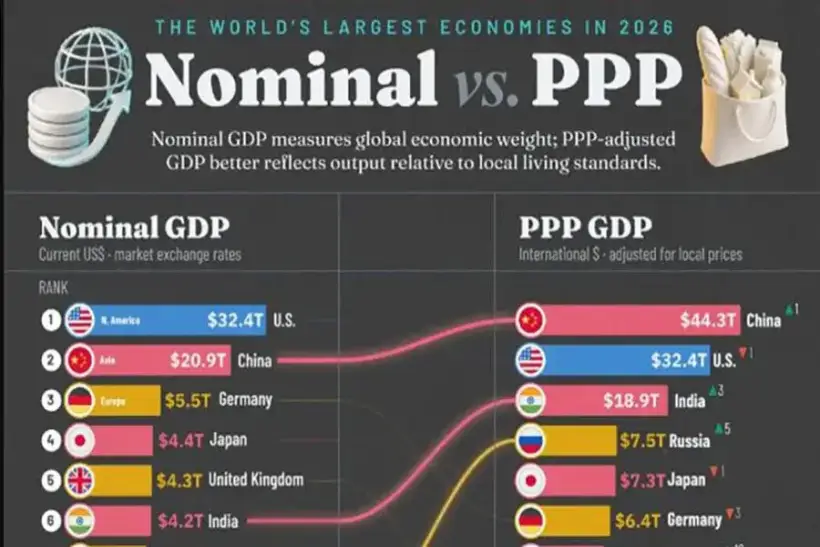
Visual Capitalist has published a ranking of the world’s largest economies in 2026, comparing their positions by nominal GDP and purchasing power parity. The calculations are based on the International Monetary Fund’s April forecast and reveal significant differences in the global economic hierarchy depending on the indicator used.
US Leads by Nominal GDP
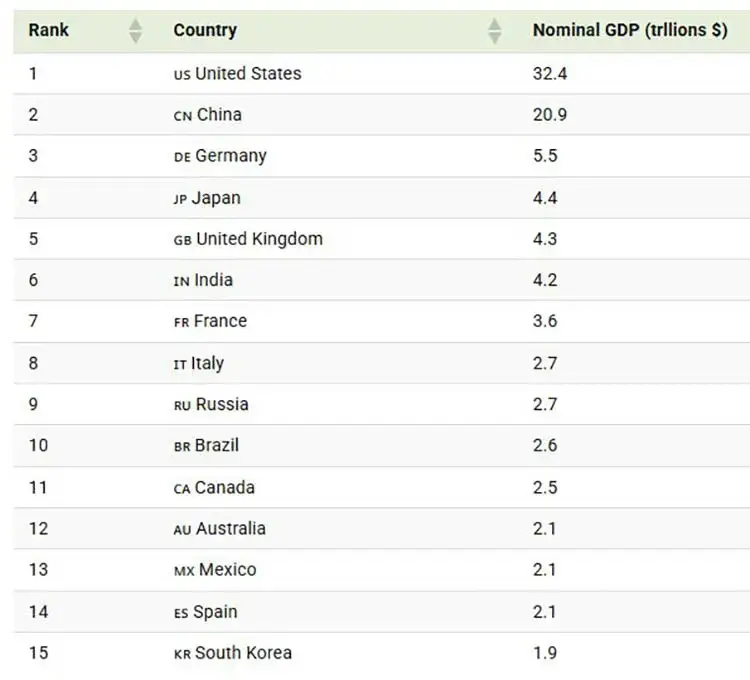
The United States remains the world’s largest economy by nominal GDP. In 2026, the IMF projects the US figure at $32.4 trillion, while China ranks second with $20.9 trillion. Germany completes the top three with $5.5 trillion.
Japan follows with $4.4 trillion, ahead of the United Kingdom at $4.3 trillion, India at $4.2 trillion, and France at $3.6 trillion. Italy ranks eighth with $2.7 trillion, while Russia is ninth with roughly the same amount. Brazil takes tenth place with $2.6 trillion.
This comparison is based on market exchange rates. The method is important for assessing the size of financial markets, international trade, and an economy’s role in global financial flows, although the results can be significantly affected by fluctuations in national currencies.
China Ranks First by PPP
The ranking changes substantially when GDP is adjusted for purchasing power parity. This indicator accounts for differences in price levels between countries and makes it possible to compare the amount of goods and services that can be purchased for an equivalent sum across different economies.
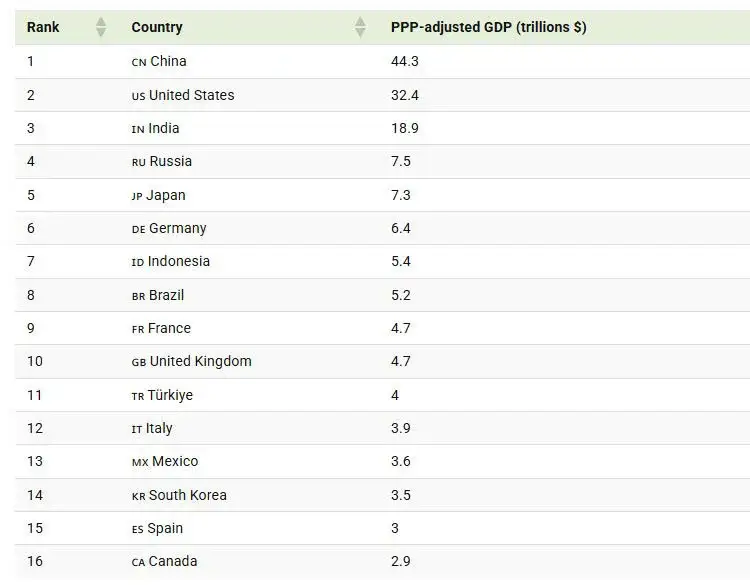
China ranks first by this measure, with GDP at purchasing power parity of around $44.3 trillion. The United States falls to second place with $32.4 trillion, while India strengthens its position in third with $18.9 trillion.
Russia ranks fourth at around $7.5 trillion. It is followed by Japan at $7.3 trillion, Germany at $6.4 trillion, Indonesia at $5.4 trillion, and Brazil at $5.2 trillion. France and the United Kingdom complete the top ten, with PPP-adjusted GDP estimated at around $4.7 trillion each.
Russia Is the Fourth-Largest Economy by PPP
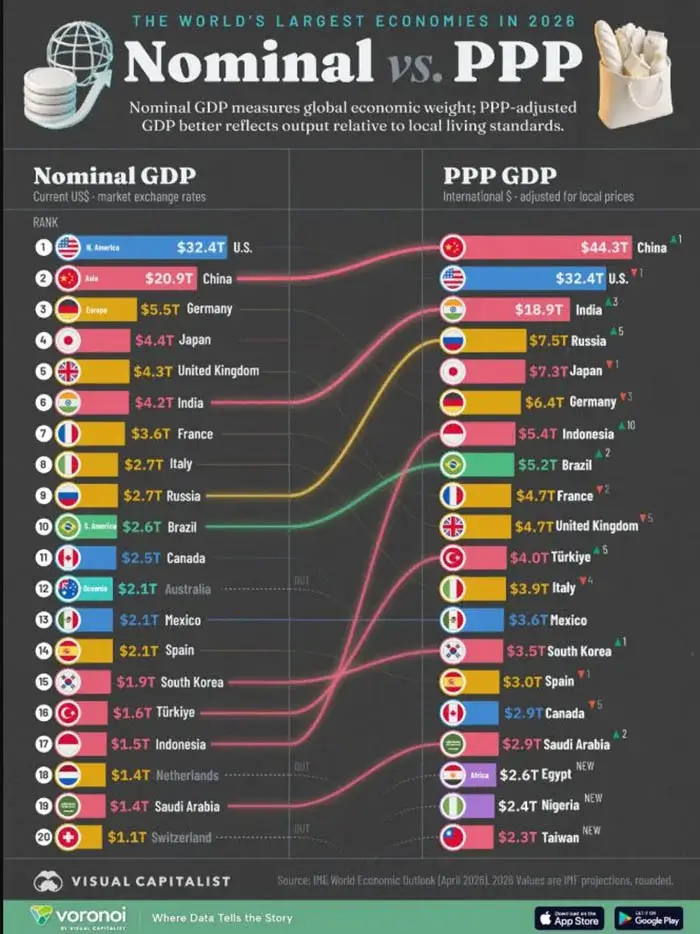
The difference between the two methodologies is particularly noticeable in Russia’s case. The country ranks ninth by nominal GDP, at around $2.7 trillion, but rises to fourth place when domestic price levels are taken into account, with PPP-adjusted GDP of approximately $7.5 trillion.
Visual Capitalist notes that the PPP calculation moves Russia from fifth to first place among European economies. The gap is mainly explained by lower price levels compared with the largest developed economies: the same amount expressed in US dollars can purchase a greater volume of goods and services within Russia.
The result is also supported by an earlier Visual Capitalist ranking published in March 2026. Based on a previous set of IMF forecasts, Russia’s GDP at PPP was estimated at $7.34 trillion, also placing it fourth behind China, the United States, and India.
India and Indonesia Gain Ground
The PPP adjustment has a particularly strong impact on the positions of major emerging economies. India moves from sixth place by nominal GDP to third, behind only China and the United States. Indonesia makes an even larger jump. With nominal GDP of around $1.5 trillion, it ranks 17th, but rises ten places to seventh under the PPP measure, with $5.4 trillion.
The opposite pattern can be seen in several developed economies with relatively high domestic prices. Canada ranks 11th by nominal GDP but only 16th by PPP, while Spain moves from 14th to 15th place. Switzerland is among the world’s 20 largest economies by nominal GDP but does not make the top 20 by PPP.
What Purchasing Power Parity Shows
The IMF calculates GDP at PPP by converting national GDP into international dollars using a special conversion factor that reflects differences in price levels. An international dollar represents the amount of goods and services that one US dollar can purchase in the United States.
The method does not replace nominal GDP, as the two indicators serve different purposes. Market exchange rates are better suited to measuring a country’s financial weight, its capacity in foreign trade, and its role in international transactions, while PPP provides a more accurate comparison of the real scale of production and domestic purchasing power across economies.
The 2026 ranking demonstrates how strongly the choice of methodology can affect perceptions of the world’s largest economies. The United States remains the clear leader when GDP is converted at market exchange rates, while the PPP measure puts China in first place and significantly strengthens the positions of India, Russia, and Indonesia. The 2026 figures are IMF forecasts rather than final annual data and may be revised in subsequent editions of the World Economic Outlook.