


Hotel prices ahead of the 2026 FIFA World Cup: how the match calendar is driving rates

The hospitality industry in 16 cities across the US, Canada, and Mexico ahead of the tournament
The 2026 FIFA World Cup will be held in the United States, Canada, and Mexico and will become the largest tournament in the competition’s history, with 104 matches scheduled across 16 cities, Lighthouse notes. Following the official draw, the hospitality market began revising room rates based on the distribution of matches and the expected surge in demand. The match calendar is uneven: Dallas (Arlington) will host nine games, while Atlanta, Los Angeles, and New York/New Jersey will each host eight.
What happened to hotel room prices
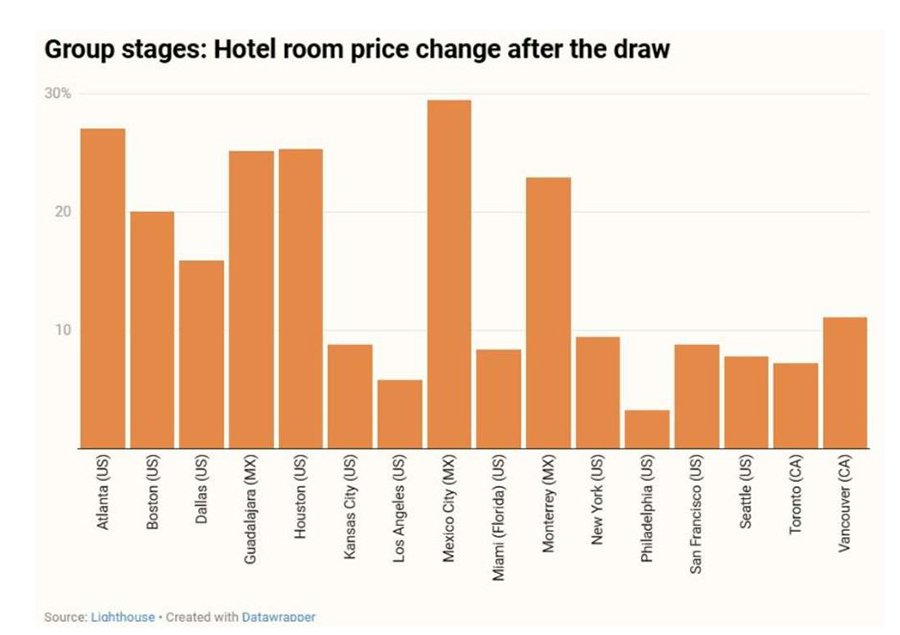
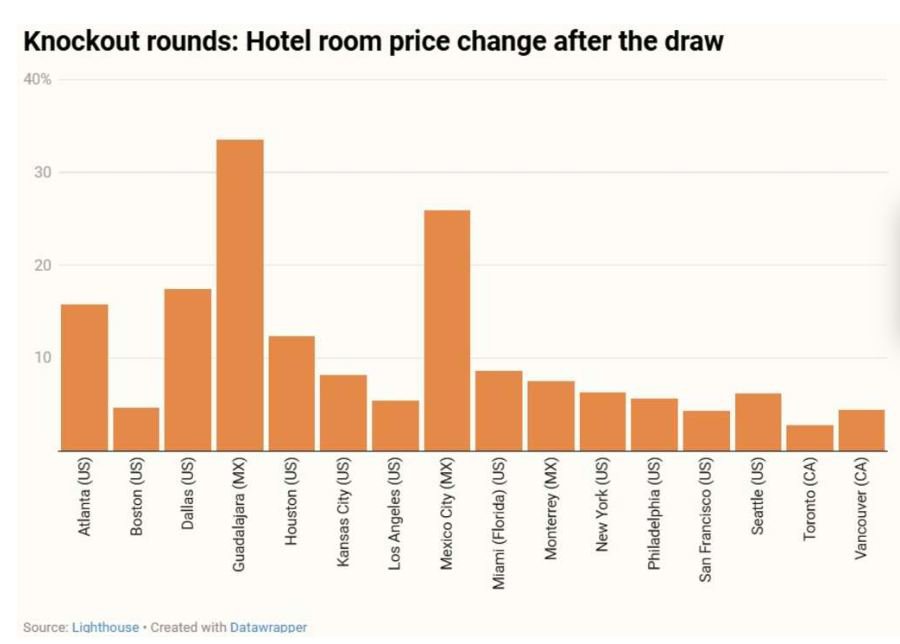
The official draw became the starting point for a broad reassessment of pricing strategies in host cities. On average, accommodation prices increased by 14.75% across all destinations, while the overall market effect amounted to 13.74%, translating into a rise in the average nightly rate from $438 to $499.
The most notable growth was recorded in Mexico City, Atlanta, Houston, Guadalajara, and Monterrey, where rates climbed by 22–29%. Philadelphia showed the smallest change, with an increase of around 3%.
The gap between markets remains significant. Vancouver emerged as the most expensive group-stage destination, with an average rate of about $1,230 per night, while Houston remains the most affordable city at roughly $225. Even after the overall increase, the difference between the highest and lowest markets exceeds sixfold.
Knockout stage: contrasts intensify
During the knockout rounds, the pricing model shifts. While the group stage was marked by broad volatility, price dynamics during the playoffs become more localized and concentrated in specific cities.
The strongest post-draw increases were recorded in Guadalajara, Mexico City, and Dallas. At the same time, Toronto, San Francisco, and Vancouver showed almost no movement, suggesting that high baseline pricing had already been built in. The average increase for the knockout stage stands at around 10.5%. The most expensive destinations remain Vancouver, New York, and Boston, both before and after the tournament bracket was published.
How prices evolved as the tournament approached
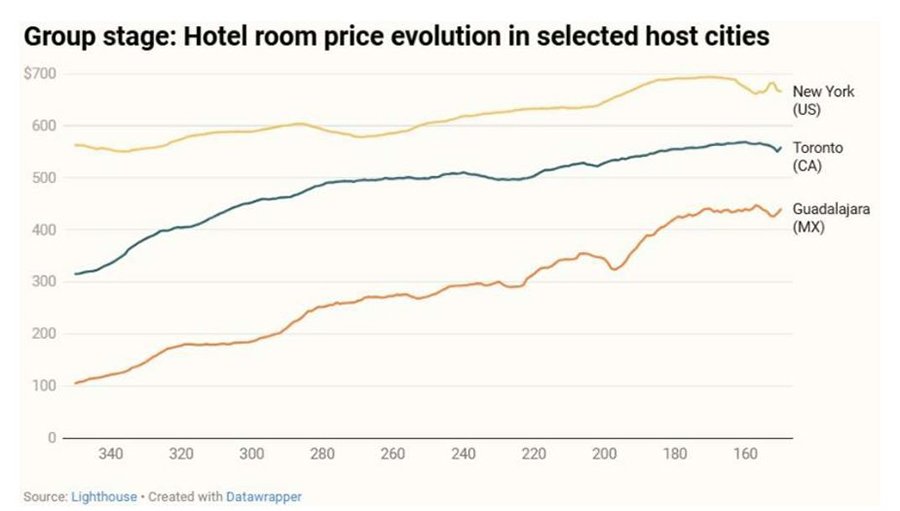
Group stage: triple-digit adjustments
Price dynamics from roughly 350 days out to 147 days before the event show that several markets effectively rewrote their price lists. The most extreme example is Guadalajara, where rates nearly quadrupled from $105 to $511. Vancouver posted the largest absolute increase, rising by more than $430.
Significant growth was also observed in Monterrey, Mexico City, Dallas, and Houston. Miami stood out as the only market where accommodation prices declined slightly. The timing of price peaks is also telling. In Guadalajara, Mexico City, Toronto, and Houston, peak values occurred at the very end of the observation window, indicating continued acceleration. San Francisco reached its peak earlier and then showed a more stable trend.
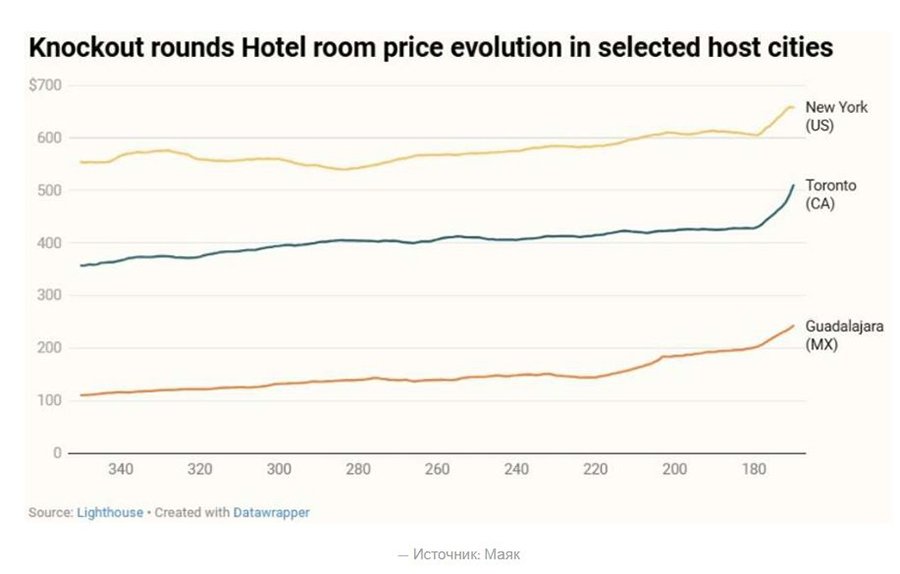
Market volatility
For the knockout rounds, the average price increase over the observation period approached 80%, but the dispersion was highly uneven. Mexico and Kansas City experienced sharp spikes, while New York and San Francisco remained within a moderate growth range.
As a result, cities clearly diverged by behavior. New York and Boston appear expensive but predictable. Monterrey, Guadalajara, and Kansas City are more affordable but highly volatile. Vancouver combines high prices with instability. Houston and San Francisco remain the most balanced markets in terms of price and predictability. Peak pricing across most destinations tends to form around 5.5–6 months before the start of matches.
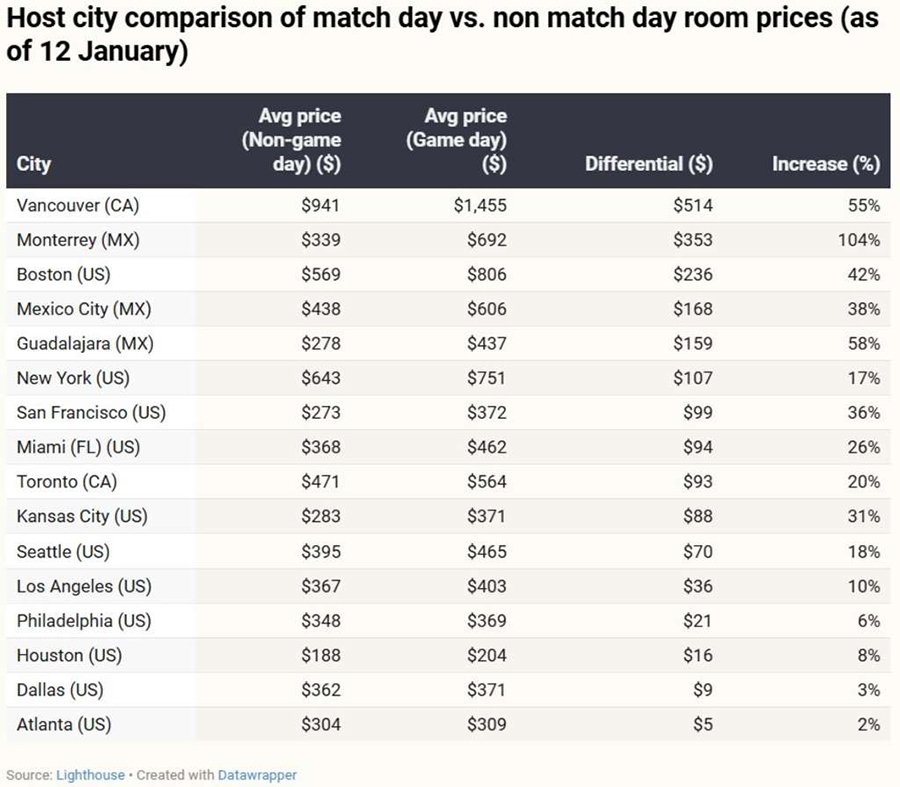
Match days vs non-match days: the cost of the “event effect”
The clearest contrast emerges when comparing match days with non-match days. On average, a night in a host city on a match day costs about $524, compared to around $398 on regular dates. The difference reaches $125, representing a premium of roughly 31%.
The largest gap is observed in Vancouver, where the surcharge exceeds $500 per night. In Monterrey, accommodation prices on match days effectively double. Among US markets, Boston shows the highest sensitivity to match-day pricing.
The smallest deviations are seen in Atlanta, Dallas, Philadelphia, and Houston, where a large volume of hotel supply smooths demand spikes and makes prices more predictable.
How hoteliers think: pricing logic
According to Lighthouse, the observed dynamics reflect deliberate revenue management strategies rather than a simple reaction to tourist demand. Lead-time calibration plays a key role. In high-cost markets, elevated initial rates are used as a filter to avoid filling rooms too early with low-margin bookings. Vancouver, New York, and Boston maintain high price floors in anticipation of more lucrative segments, including sponsors, media, and official tournament stakeholders.
During mega-events, demand structures shift. Corporate travel and conferences tend to leave host cities, making room for event-driven segments. Hoteliers balance between group contracts and potentially more profitable individual bookings closer to match dates.
In some markets, growth is achieved not only through pricing but also through rules. Instead of sharp rate hikes, hotels introduce minimum length-of-stay restrictions to protect shoulder nights and avoid empty gaps in occupancy.
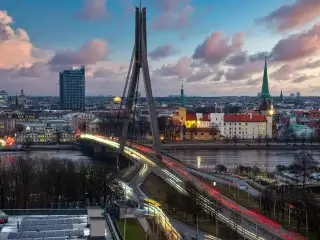
Why Vancouver is the most expensive market of the tournament
Vancouver consistently outperforms other cities in terms of price levels, including New York. Over the past two decades, the city’s hotel room supply has effectively shrunk, and during the pandemic around 550 rooms were removed from the market due to conversion into social housing. At the same time, demand continued to grow while new projects progressed slowly.
The situation was exacerbated by tighter short-term rental regulations. New legislation in British Columbia significantly reduced Airbnb supply, pushing a large share of demand back into hotels. Additional pressure comes from seasonality. In summer, Vancouver hosts around 1.2 million cruise passengers per year, and a single large ship can occupy up to one-fifth of downtown hotel inventory in a single day. Rising labor costs further contribute to higher rates, as wages in the hospitality sector have increased by roughly one-third and are directly passed on to guests.
Conclusion
Analysts at International Investment note that the 2026 FIFA World Cup does not produce a single unified model for the entire market. Mexico is experiencing sharp and unstable pricing adjustments. Vancouver faces chronic supply shortages and persistently high rates. US markets are keeping growth under control thanks to larger room inventories and more flexible sales strategies.
For hoteliers, the tournament becomes not only a period of elevated demand but also a serious management stress test. In some cities, price growth proves most effective; in others, inventory control and access restrictions dominate; elsewhere, maintaining high base rates well in advance of the event becomes the winning strategy.
In effect, the World Cup is turning into the largest revenue management experiment in the history of the North American hospitality industry, and its outcomes are likely to serve as a benchmark for future mega-events.